Correlation and Regression Models

Part 2

Esteban Montenegro-Montenegro, PhD

Psychology and Child Development

My aims in this lecture

  • To introduce basic notions of the regression model

  • To start thinking about statistical models with more variables (exciting times!)

  • To encourage you to think about more realistic research questions (this might take several sessions!)

library(knitr)
library(kableExtra)
library(dplyr)

Attaching package: 'dplyr'
The following object is masked from 'package:kableExtra':

    group_rows
The following objects are masked from 'package:stats':

    filter, lag
The following objects are masked from 'package:base':

    intersect, setdiff, setequal, union
library(gghighlight)
Loading required package: ggplot2
library(ISLR)
library(DT)

What is a regression model ?

  • You might be thinking, is regression something related that happened in the past?

  • Is related to study something that might happen in the future?

  • Regression is a weird word!

What is a regression model ? (cont.)

In this lecture we will follow ideas from Westfall & Arias (2020):

  • Regression models are used to relate a variable \(Y\) with a single variable \(X\) or multiple variables \(X_{1}, X_{2}, ..., X_{k}\)

  • Some questions that you might answer with a regression model:

  • How does a person’s choice of toothpaste (\(Y\)) relate to the person’s age (\(X_{1}\)) and income (\(X_{2}\))?

  • How does a person’s cancer remission status (\(Y\)) relate to their chemotherapy regimen (\(X\))?

  • How does a person’s self-esteem (\(Y\)) relates to time in social media (\(X_{1}\)) and number of followers (\(X_{2}\))

What is a regression model ? (cont.)

  • A regression model can help you to predict what an unknown \(Y\) will be for a given fixed value of \(X\). Prediction is more like a “what-if” analysis. It is a prediction about the future but also , you can answer what might have happened in the past.

  • A regression model can be represented as:

\[\begin{equation} Y|X = x \sim p(y|x) \end{equation}\]
  • This means the expression \(p(y|X=x)\) is the distribution of potentially observable \(Y\) values when \(X = x\), and is called the conditional distribution of \(Y\), given that \(X = x\).

  • In simple words, in regression we are estimating a conditional distribution. I know that we are going fast in this class, but the examples and the exercises in this class my help later.

  • We can also represent the regression model as \(p(y|x)\). It is shorter!

We can talk more about conditional distributions

  • Let’s imagine you need to predict the development of episodic memory in humans. You will need to use age of the individual to predict their memory score. Let’s imagine you want to predict the probability of the memory score (\(X\)) when age = 27 years old. But also, you need predict the memory score when individuals are 5 years old.

  • The model \(p(y|x)\) does not assume any distribution, it doesn’t assume whether the distribution is discrete or continuous. But we will use a Gaussian process to represent the conditional statements \(p(y|X=27)\) and \(p(y|X = 5)\)

We can talk more about conditional distributions (cont.)

  • The model only assumes that there is a distribution of possible values in Nature when age = 27 and age = 5

But soon we will assume a distribution

Westfall & Arias (2020):

Families of conditional distributions
When p(y|x) are Assumed to be: Then you have…
Poisson Poisson regression
Negative binomial Negative binomial regression
Bernoulli Logistic regression
Normal Classical regression
Multinomial Multinomial logistic regression
Beta Beta regression
Lognormal Lognormal regression
  • This is not a final list of possible regression models, but at least the most popular ones.
  • We won’t have time to study all of them, in the best scenario we will study three different regression models: Poisson regression, Logistic regression, and Classical regression.

Important to remember!

Westfall & Arias (2020):

Important

The regression model \(p(y|x)\) does not come from the data. Rather, the regression model \(p(y|x)\) is assumed to produce the data.

  • Models produce data, data DOES NOT produce models!

Variable \(X\) and Variable \(Y\): Beasts of many names

  • In regression you’ll find several names for \(X\):

    • predictor variable(s)
    • descriptor variable(s)
    • feature variable(s)
    • independent variable(s)
    • exogenous variable(s)
    • response/predictor
  • Also several names for \(Y\):

    • response variable
    • target variable
    • criterion variable
    • dependent variable
    • endogenous variable

Variable \(X\) and Variable \(Y\): Beasts of many names

  • The DATA in regression models looks like this:

Example Time

  • Let’s do preliminary model:

    • This is the data named "Wage" it comes from the package ISLR. It has information of variables related to wages for a group of males from the Atlantic region of the United States.
library(ISLR)
library(DT)

datatable(Wage)

Example Time (cont.)

Let’s fit a regression model were age will be a predictor of wage. This means \(X = age\) and \(Y= wage\) :

fitModel <- lm(wage ~ age, data = Wage)
summary(fitModel)

Call:
lm(formula = wage ~ age, data = Wage)

Residuals:
     Min       1Q   Median       3Q      Max 
-100.265  -25.115   -6.063   16.601  205.748 

Coefficients:
            Estimate Std. Error t value Pr(>|t|)    
(Intercept) 81.70474    2.84624   28.71   <2e-16 ***
age          0.70728    0.06475   10.92   <2e-16 ***
---
Signif. codes:  0 '***' 0.001 '**' 0.01 '*' 0.05 '.' 0.1 ' ' 1

Residual standard error: 40.93 on 2998 degrees of freedom
Multiple R-squared:  0.03827,   Adjusted R-squared:  0.03795 
F-statistic: 119.3 on 1 and 2998 DF,  p-value: < 2.2e-16
  • The estimate column shows two important rows, the first one is the intercept this is the starting point of a line (more about it later). The second row is an estimate for age this is called the slope. It tells you the rate of change.

  • In this case it is telling us that, for each year of age, these males earned \(0.70728*1000=\$707.28\) more. We’ll talk about it later.

Example Time (cont.)

ggplot(data = Wage, aes(x=age, y=wage)) +
  geom_point()+ geom_smooth(method = "lm")+
  theme_classic()
`geom_smooth()` using formula = 'y ~ x'

It is time for assumptions!

Classical Regression Model

  • The model that we just ran is named Classical Regression Model, many people call it linear regression, other people call it Gaussian regression.

  • I prefer to call it Classical Regression Model (Westfall & Arias, 2020).

  • This is how the model looks like in many books:

\[\begin{equation} Y = \beta_{0}+ \beta_{1}X + \epsilon \end{equation}\]
  • We will talk about this model very often, but before going straight to bussiness we need to talk about assumptions.

Classical Regression Model: Assumptions

  • Remember: Models produce data! Then, models are explanations of what happens in Nature.

  • The first assumption is randomness, many books only assume this concept but it doesn’t hurt to make it explicit.

  • Randomness in this context means that:

Note

The value of \(Y\) is variable, coming randomly from a distribution \(p(y|x)\) of potentially observable \(Y\) values that is specific to the particular values (\(X = x\)) of the \(X\) variables (Westfall & Arias, 2020).

  • In simple words, we assume \(Y\) is variable produced randomly by a conditional distribution \(p(y|X)\).

  • But of course, we test if there is a dependency between \(y\) and \(x\). That’s part of the job.

Classical Regression Model: Assumptions (cont.)

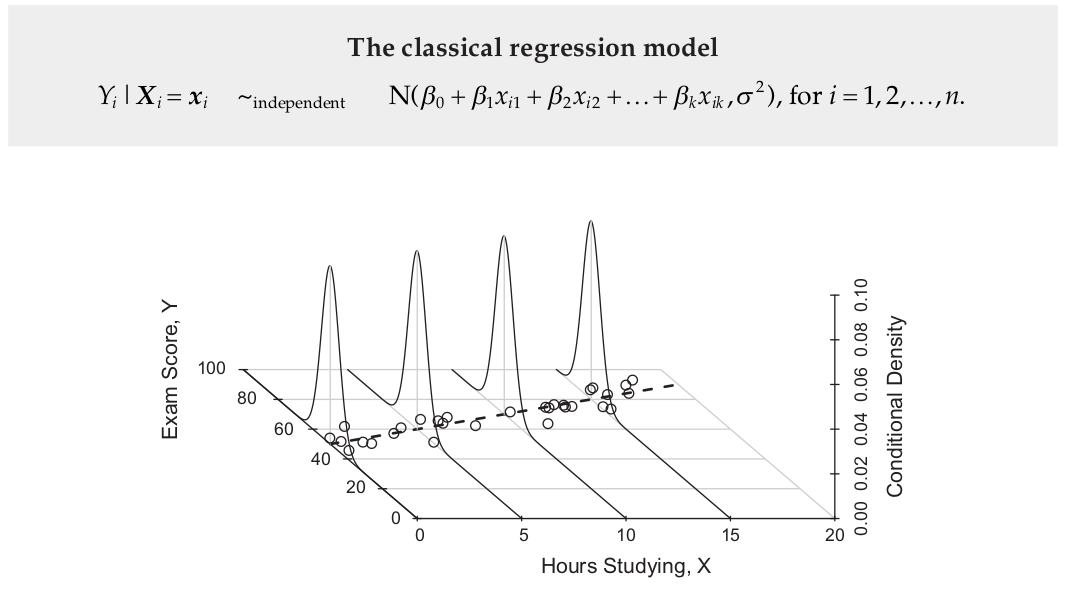
  • Remember when I showed you that \(p(y|x)\) is assuming a distribution for each \(x\)?

  • There is a conditional mean function in the Classical Regression Model, the expression looks like this:

\[\begin{equation} f(x) = E(Y|X=x) \end{equation}\]

In this formula \(E\) means expectation or expected value. In this case the expected value is the collection of means of the conditional distributions.

Classical Regression Model: Assumptions (cont.)

  • There is an assumption of constant variance (homoscedasticity).

  • Given that we are assuming there are several distributions, each \(x\) has a distribution, we also assume that the variance in this conditional distributions is the same or constant.

Note

The variances of the conditional distributions \(p(y|x)\) are constant (i.e., they are all the same number, \(\sigma^2\)) for all specific values \(X = x\) (Westfall & Arias, 2020).

Classical Regression Model: Assumptions (cont.)

  • There an important assumption which is normality.

  • The Classical Regression Model or linear model, assumes all the conditional distributions are produced by a normal distribution or Gaussian distribution.

Note

The conditional probability distribution functions \(p(y|x)\) are normal distributions (as opposed to Bernoulli, Poisson, or other) for every \(X = x\).(Westfall & Arias, 2020).

Classical Regression Model: Assumptions (cont.)

Westfall & Arias (2020):

Classical Regression Model: Assumptions (cont.)

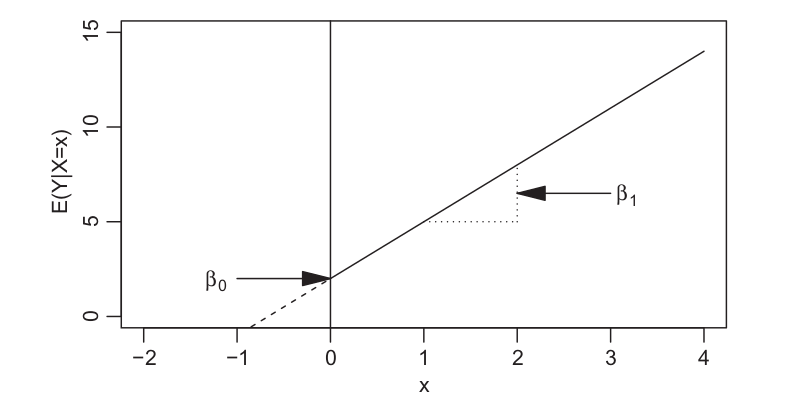
  • There is also an assumption of linearity.

  • This assumption states that the means of the conditional distributions \(p(y|x)\) fall precisely on a straight line of the form \(\beta_{0} + \beta_{1}x\)

  • When we assume linearity the parameter \(\beta_{O}\) is the mean of \(Y\) when the parameter \(\beta_{1} = 0\).

  • To make \(\beta_{1} = 0\) we would just need to multiply it by zero: \(\beta_{0} + \beta_{1}(0)\).

  • But, what happens if \(x\) does not have zero? Well, in that case, \(\beta_{0}\) would not be exactly the mean of \(Y\) , instead \(\beta_{0}\) would be the vertical height or distance from zero.

  • In this case, \(\beta_{1}\) is a parameter that indicates the difference between conditional means.

Westfall & Arias (2020):

Ordinary Least Squares

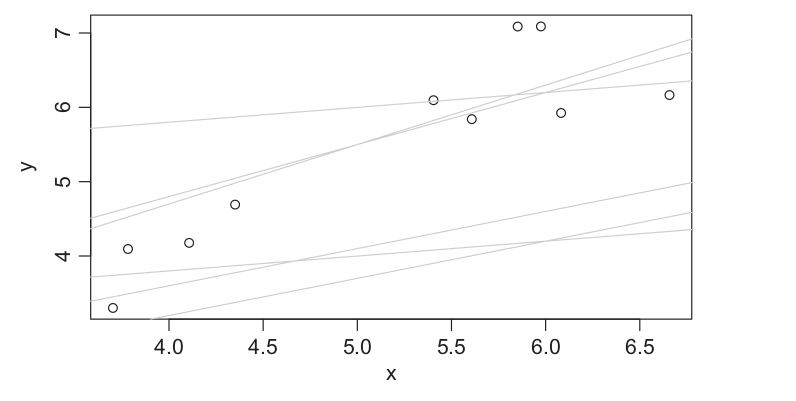
  • I have mentioned before in class, the existence of a line of best fit

  • This is the time to study what is this line.

  • One fo the estimation methods in the Classical Regression Model is Ordinary Least Squares estimation.

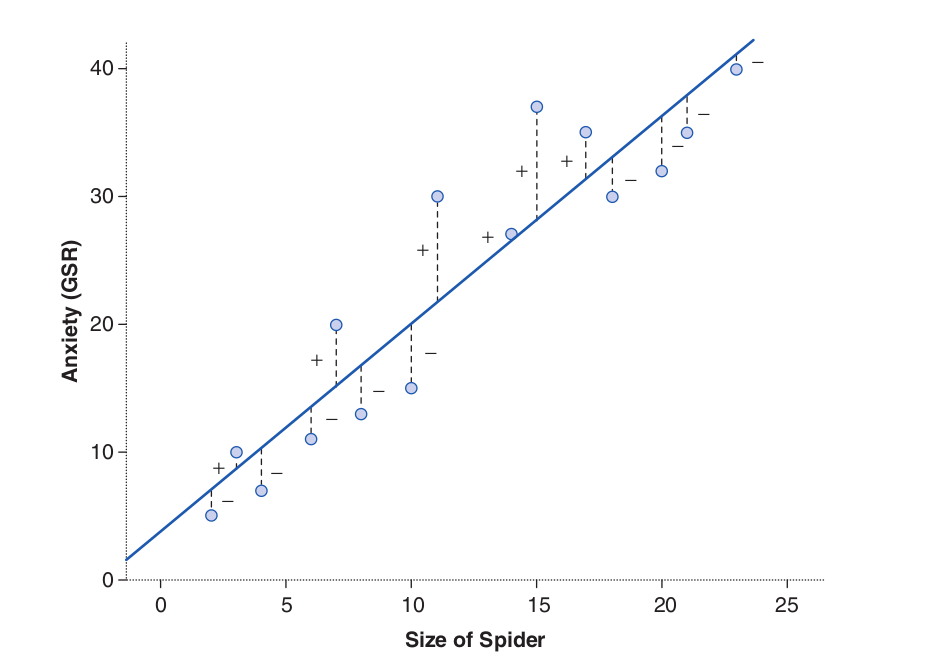
  • In this method, we draw a line in every possible direction, and calculate the distance of each value from the line. After calculating the distance form the line, we square those distances and add them together. This is what we call a Sum of Squares. The line that produces the lowest Sum of Squares is the line of best fit.

Figure 1: Field et al. (2012) and Westfall & Arias (2020)

Wage data example

  • By this point we should talk more about our applied example.

  • Let’s see what happens when we assume \(\beta_{1} = 0\) by just removing age from the regression model.

fitModel <- lm(wage ~ 1, data = Wage)
summary(fitModel)

Call:
lm(formula = wage ~ 1, data = Wage)

Residuals:
    Min      1Q  Median      3Q     Max 
-91.618 -26.320  -6.782  16.977 206.639 

Coefficients:
            Estimate Std. Error t value Pr(>|t|)    
(Intercept) 111.7036     0.7619   146.6   <2e-16 ***
---
Signif. codes:  0 '***' 0.001 '**' 0.01 '*' 0.05 '.' 0.1 ' ' 1

Residual standard error: 41.73 on 2999 degrees of freedom
  • This is what we call the intercept only model, it can also be considered a null model. Remember those words? In this model, we are not modeling any relationship. The regression model returns exactly the mean of wage. If you don’t believe me you can see it:
mean(Wage$wage)
[1] 111.7036
  • It is the same value as the intercept!

  • Let’s add again age as a predictor:

fitModel <- lm(wage ~ age, data = Wage)
summary(fitModel)

Call:
lm(formula = wage ~ age, data = Wage)

Residuals:
     Min       1Q   Median       3Q      Max 
-100.265  -25.115   -6.063   16.601  205.748 

Coefficients:
            Estimate Std. Error t value Pr(>|t|)    
(Intercept) 81.70474    2.84624   28.71   <2e-16 ***
age          0.70728    0.06475   10.92   <2e-16 ***
---
Signif. codes:  0 '***' 0.001 '**' 0.01 '*' 0.05 '.' 0.1 ' ' 1

Residual standard error: 40.93 on 2998 degrees of freedom
Multiple R-squared:  0.03827,   Adjusted R-squared:  0.03795 
F-statistic: 119.3 on 1 and 2998 DF,  p-value: < 2.2e-16
  • Now the coefficient for the estimated intercept changed. This happened because now the intercept represents the average wage when age is zero. But wait, you cannot have a zero age and get a salary? In this case, the intercept misses the interpretation, then it represents the height from zero.

Wage data example

Show the code
plot(Wage$age, Wage$wage, 
     pch = 16, 
     cex = 0.7, 
     col = "blue",
     xlab = "Age",
     ylab = "Wage",
     main = "Line of Best Fit Linear Regression")
abline(lm(wage ~ age, data = Wage), col = "red")

Wage data example

  • If we want to interpret the intercept in the way the linear model specifies. We can transform age to get a meaningful zero.

  • There is something call \(z\)-values, others call it \(z\)-scores. This tranformation is based on the normal distribution.

  • Let’s see the formula to transform any continuous distribution into \(z\) values:

\[\begin{equation} z= \frac{x_{i}-\bar{x}}{\sigma} \end{equation}\]

Where: - \(x_{i}\) is each observed value. - \(\bar{x}\) is the mean of the observed values. - \(\sigma\) is the standard deviation of the observed values.

  • As you can see, what we do is to tranform the distribution, now the observed values will be centered at zero. It means the mean is going to be zero, and the values will be negative and positive values.

  • In R you can transform any continiuos distributin into \(z\)-values using the function scale().

Wage$age_Z <- scale(Wage$age)
summary(Wage[, c("age", "age_Z")])
      age             age_Z.V1      
 Min.   :18.00   Min.   :-2.115215  
 1st Qu.:33.75   1st Qu.:-0.750681  
 Median :42.00   Median :-0.035925  
 Mean   :42.41   Mean   : 0.000000  
 3rd Qu.:51.00   3rd Qu.: 0.743808  
 Max.   :80.00   Max.   : 3.256282  
  • In the example above, you can see that the mean of age is now zero after transforming the distribution. Also, notice that age_Z ranges from -2.12 to 3.26.

  • Given that now we have \(z\)-values we can interpret the values in terms of standard deviations from the mean. For instance, we can say that 18 years old is a value located -2.12 standard deviation below the mean (because the value is negative), we can also say that 80 years old is a value located 3.26 standard deviations above the mean (because the value is positive)

Wage data example

Let’s add age_Z variable to our regression model:

Show the code
fitModel <- lm(wage ~ age_Z, data = Wage)
summary(fitModel)

Call:
lm(formula = wage ~ age_Z, data = Wage)

Residuals:
     Min       1Q   Median       3Q      Max 
-100.265  -25.115   -6.063   16.601  205.748 

Coefficients:
            Estimate Std. Error t value Pr(>|t|)    
(Intercept) 111.7036     0.7473  149.48   <2e-16 ***
age_Z         8.1637     0.7474   10.92   <2e-16 ***
---
Signif. codes:  0 '***' 0.001 '**' 0.01 '*' 0.05 '.' 0.1 ' ' 1

Residual standard error: 40.93 on 2998 degrees of freedom
Multiple R-squared:  0.03827,   Adjusted R-squared:  0.03795 
F-statistic: 119.3 on 1 and 2998 DF,  p-value: < 2.2e-16
  • Do you see what happened? After transforming age into values with a real zero, the intercept now shows the mean of wage. If you don’t believe it, let’s estimate again the mean of wage:
mean(Wage$wage)
[1] 111.7036
  • It is the same number! Then it is true, the intercept is the mean of \(Y\) when \(\beta_{1}\) has a real zero among the possible values.

  • Then we can interpret the result as: for 1-unit increment in age_Z, wage increases $816.37. Also you can say: for 1-standard deviation increment, wage increases $816.37.

Wage data example

  • We can also transform wage into \(z\)-values, this will make the interpretation fully standardized:
Show the code
options(scipen = 999)

Wage$wage_Z <- scale(Wage$wage)

summary(lm(wage_Z ~ age_Z, data = Wage))

Call:
lm(formula = wage_Z ~ age_Z, data = Wage)

Residuals:
    Min      1Q  Median      3Q     Max 
-2.4028 -0.6019 -0.1453  0.3978  4.9306 

Coefficients:
                         Estimate            Std. Error t value
(Intercept) 0.0000000000000001415 0.0179076042933873671    0.00
age_Z       0.1956372015635888528 0.0179105896404604427   10.92
                       Pr(>|t|)    
(Intercept)                   1    
age_Z       <0.0000000000000002 ***
---
Signif. codes:  0 '***' 0.001 '**' 0.01 '*' 0.05 '.' 0.1 ' ' 1

Residual standard error: 0.9808 on 2998 degrees of freedom
Multiple R-squared:  0.03827,   Adjusted R-squared:  0.03795 
F-statistic: 119.3 on 1 and 2998 DF,  p-value: < 0.00000000000000022
  • After standardizing wage we have an intercept that is almost zero, this makes sense because the mean of wage is now zero. It is actually zero, but models are not perfect, they are approximations, and there is randomness, that’s why the intercept is not exactly zero.

  • In this model, we could interpret the estimate of age_Z like it was a correlation, because it is standardized. We can also say: for 1-standard deviation increase in age, wage increases 0.20 standard deviations.

Fun fact: \(t\)-test is a linear regression extension

  • Up to this point I have talked only about the case where the predictor has a continuous distribution. But, what happens when our predictor has discrete values (e.g gender, academic level)?

  • The Classical Regression Models does not assume anything about the predictors. We can actually use any discrete variable.

  • As always, we can understand what happens with a binary predictor by running an example:

Show the code
### I'm going to transform the values, so I can get a variable where 1 = have insurance, 0 = does not have insurance.

Wage$dummyHealth <- ifelse(Wage$health_ins == "2. No", 0, 1)  ### This is a "if else statement".

## Let's test if having an insurance predicts differences in wage

fitWage <- lm(wage ~ dummyHealth, data = Wage)

summary(fitWage)

Call:
lm(formula = wage ~ dummyHealth, data = Wage)

Residuals:
    Min      1Q  Median      3Q     Max 
-87.872 -25.355  -5.763  15.919 217.255 

Coefficients:
            Estimate Std. Error t value            Pr(>|t|)    
(Intercept)   92.317      1.311   70.41 <0.0000000000000002 ***
dummyHealth   27.922      1.573   17.75 <0.0000000000000002 ***
---
Signif. codes:  0 '***' 0.001 '**' 0.01 '*' 0.05 '.' 0.1 ' ' 1

Residual standard error: 39.7 on 2998 degrees of freedom
Multiple R-squared:  0.09505,   Adjusted R-squared:  0.09475 
F-statistic: 314.9 on 1 and 2998 DF,  p-value: < 0.00000000000000022
  • Let’s digest the information from this example:

    • The model that we are fitting looks like this: \(y_{wage} = \beta_{0} + \beta_{1}insuranceYES + \epsilon\).
    • When the variable is discrete there is a reference group. Normally, the reference group is coded as \(0\) and the target group is coded as \(1\). This is tipically known as dummy coding.
  • The above table gave a value for the intercept. That intercept, in simple words; is the mean when \(dummyHealth = 0\). The slope in the table is 27.922, that number is in simple terms the mean difference in wage between groups.

  • Don’t you believe it? Let’s see it next:

Fun fact: \(t\)-test is a linear regression extension

First, let’s see the mean of each group:

Show the code
Wage %>% select(dummyHealth, wage) %>% 
  group_by(dummyHealth) %>%
  summarise(mean = mean(wage),
            sd = sd(wage)) %>%
  kbl(caption = "Wage's mean and standard deviation by insurance status") %>%
kable_classic_2("hover", full_width = F,bootstrap_options = c("striped", "hover", "condensed", "responsive")) %>%
  footnote(general = "Not insurance = 0, Insurance = 1")
Wage's mean and standard deviation by insurance status
dummyHealth mean sd
0 92.3167 35.97190
1 120.2383 41.23698
Note:
Not insurance = 0, Insurance = 1
  • In the table you can see that the mean of \(Insurance = 0\) is 92.32! Just like we expected!

  • Now let’s compute the mean difference:

120.2383-92.3167
[1] 27.9216
  • Again! If you check our regression result the slope was 27.922, that’s exactly the mean difference!

  • What is the message here? When add dummy coded variables in a Classical Regression Model, you are measuring how far is the mean of \(group = 0\) from \(group = 1\), it simple words: it is a \(t\)-test.

Fun fact: \(t\)-test is a linear regression extension

-Let’s see it with a plot

Show the code
plot(Wage$dummyHealth, Wage$wage,
     xlab = "Insurance Status",
     ylab = "Wage",
     main = "A scatterplot of wage by insurance status",
     xaxt = "n")

# X-axis
axis(1, at = c(0, 1))
abline(lm(wage ~ dummyHealth, data = Wage), col = "red")

What if my predictor has multiple categories?

  • You might wonder, what if my predictor has multiple groups?

  • We can also transform multiple categories into several dummy coded variables, that means, the categories will become variables coded with \(0\) or \(1\).

  • We can answer the following question:

  • Is race related to wage? If so, how different is the average wage compared to White Americans?

  • In the data set Wage there is a variable named race. We can check its values:

Show the code
 Wage %>% count(race) %>%
   kbl(caption = "Number of participants in each race group")%>%
  kable_classic_2("hover", 
                  full_width = F,
                  bootstrap_options = c("striped", "hover", "condensed", "responsive"))
Number of participants in each race group
race n
1. White 2480
2. Black 293
3. Asian 190
4. Other 37
  • As you can see, we have 4 groups in this variable, and we need to create dummy variables.

  • We should create \(k-1\) new dummy variables, that means if you have 4 categories or groups, such as our case, we should have \(4-1= 3\) new dummy variables:

Black Asian Other
0 0 0
1 1 1
0 1 1
….
  • Now we will create 3 new variables named black, asian, and other. Each variable will have only zeros and ones. Where \(1 = YES\), and \(0 = NO\).
Show the code
Wage <- Wage %>% mutate(black = ifelse(race == "2. Black", 1, 0),
                        asian = ifelse(race == "3. Asian", 1, 0),
                        other = ifelse(race == "4. Other", 1,0))

datatable(Wage %>% select(race, black,asian,other))
  • We are ready to estimate the regression model:
Show the code
summary(lm(wage ~ black + asian + other, data = Wage))

Call:
lm(formula = wage ~ black + asian + other, data = Wage)

Residuals:
    Min      1Q  Median      3Q     Max 
-92.478 -24.708  -6.251  17.283 216.741 

Coefficients:
            Estimate Std. Error t value             Pr(>|t|)    
(Intercept) 112.5637     0.8333 135.088 < 0.0000000000000002 ***
black       -10.9625     2.5634  -4.276            0.0000196 ***
asian         7.7246     3.1236   2.473              0.01345 *  
other       -22.5903     6.8726  -3.287              0.00102 ** 
---
Signif. codes:  0 '***' 0.001 '**' 0.01 '*' 0.05 '.' 0.1 ' ' 1

Residual standard error: 41.5 on 2996 degrees of freedom
Multiple R-squared:  0.0121,    Adjusted R-squared:  0.01112 
F-statistic: 12.24 on 3 and 2996 DF,  p-value: 0.0000000589
  • Did you notice that white is not in the model? That happens because we don’t need it!

  • If you do \(k-1\) new dummy variables, you are already estimating the mean of white in the intercept.

  • You don’t believe me, right? Let’s estimate the mean of white:

Show the code
Wage %>% filter(race == "1. White" ) %>%
  summarise(mean = mean(wage),
            sd = sd(wage)) %>%
  kbl(caption = "Mean of wage when participant is White") %>%
  kable_classic_2("hover", 
                  full_width = F,
                  bootstrap_options = c("striped", "hover", "condensed", "responsive"))
Mean of wage when participant is White
mean sd
112.5637 41.73383
  • Yes! I was right! The mean of white is exactly our intercept!

  • Each slope estimated in our regression model is the mean difference compare to white group.

  • Let’s see if it true:

Show the code
Wage %>% group_by(race) %>% summarise(mean = mean(wage)) %>%
  mutate(DifferenceVsWhite = c(0, 
                               101.60118    - 112.56367 , 
                               120.28829- 112.56367 , 
                               89.97333 -112.56367)) %>% 
  kbl(caption = "Mean Differences Compare to White") %>%
    kable_classic_2("hover", 
                  full_width = F,
                  bootstrap_options = c("striped", "hover", "condensed", "responsive"))
Mean Differences Compare to White
race mean DifferenceVsWhite
1. White 112.56367 0.00000
2. Black 101.60118 -10.96249
3. Asian 120.28829 7.72462
4. Other 89.97333 -22.59034
  • Great! I was right again!

This is boring, let’s add more predictor!

Multiple predictors went to a bar…

  • In the last example we added multiple predictors after creating dummy coded variables.

  • We estimated a model named multiple regression. Many authors prefered the word multiple to explicitly mention that there are more than one predictor.

  • When you add more predictors, the Classical Regression Model looks like this:

\[\begin{equation} Y = \beta_{0}+ \beta_{1}X_{1} + \beta_{2}X_{2} + ...+ \epsilon \end{equation}\]
  • Now, this model will account for more possible variables related to \(Y\).

Multiple predictors went to a bar…

Show the code
library(scatterplot3d)
rum <- read.csv("ruminationClean.csv")
fit <- lm(depreZ ~ rumZ + worryZ, data = rum)

plot1 <- scatterplot3d(rum[c("rumZ","worryZ", "depreZ"  )], 
              angle = 60, 
              pch = 16,
              color = "steelblue",
              box = FALSE)
plot1$plane3d(fit)

Multiple predictors went to a bar…

  • In the last example, I standardized the my outcome variable depression, I also standardized the predictors rumination and worry.

  • I showed you that transforming the predictors and outcome unto \(z\)-values will help you to get stadardized estimates.

  • This is not always necessary, may software will do something like this:

\[\begin{equation} r_{XY} = \beta_{1}\Big(\frac{\sigma_{X}}{\sigma_{Y}}\Big) \end{equation}\]

-Let’s see if it works, I’ll run a regression with the raw data and compare versus a regression where I standardized the variables before fitting the model:

summary(lm(anx ~ worry, data = rum))

Call:
lm(formula = anx ~ worry, data = rum)

Residuals:
   Min     1Q Median     3Q    Max 
-5.202 -1.791 -0.462  1.538  9.935 

Coefficients:
            Estimate Std. Error t value          Pr(>|t|)    
(Intercept)  0.01671    0.56609   0.030             0.976    
worry        0.14384    0.01871   7.688 0.000000000000729 ***
---
Signif. codes:  0 '***' 0.001 '**' 0.01 '*' 0.05 '.' 0.1 ' ' 1

Residual standard error: 2.856 on 194 degrees of freedom
  (16 observations deleted due to missingness)
Multiple R-squared:  0.2335,    Adjusted R-squared:  0.2296 
F-statistic: 59.11 on 1 and 194 DF,  p-value: 0.0000000000007291
  • Next, let’s estimate the standarized slope:
0.14384*(sd(rum$worry, na.rm = TRUE)/sd(rum$anx, na.rm = TRUE))
[1] 0.4836261
  • Let’s run again the same regression with standardized trasformed variables:
summary(lm(scale(anx) ~ worryZ, data = rum))

Call:
lm(formula = scale(anx) ~ worryZ, data = rum)

Residuals:
    Min      1Q  Median      3Q     Max 
-1.6002 -0.5509 -0.1421  0.4731  3.0563 

Coefficients:
             Estimate Std. Error t value          Pr(>|t|)    
(Intercept) -0.001125   0.062746  -0.018             0.986    
worryZ       0.483627   0.062906   7.688 0.000000000000729 ***
---
Signif. codes:  0 '***' 0.001 '**' 0.01 '*' 0.05 '.' 0.1 ' ' 1

Residual standard error: 0.8784 on 194 degrees of freedom
  (16 observations deleted due to missingness)
Multiple R-squared:  0.2335,    Adjusted R-squared:  0.2296 
F-statistic: 59.11 on 1 and 194 DF,  p-value: 0.0000000000007291
  • Yes, they are the same. The software by default will use the formula\(\beta_{1}\Big(\frac{\sigma_{X}}{\sigma_{Y}}\Big)\) to standardize your regression slopes, when you analyze your data using SPSS, SAS, STATA or other statistical packages outside R.

Multiple predictors went to a bar: non-linear models

  • We have discussed that the assumption of a straight line explaining all the conditional means is many times not realistic.

  • We can actually fit a model where we give more freedom to the line.

  • How do we do this? We just have to add a polynomial term to the equation. For instance we could fit a quadractic regression model by doing something like this:

\[\begin{equation} Y = \beta_{0}+ \beta_{1}X + \beta_{2}X^2 + \epsilon \end{equation}\]
  • Simply, we square the predictor. Let’s do that with our wage data example:
fitSq <- lm(wage ~ age + I(age^2), data = Wage)
summary(fitSq)

Call:
lm(formula = wage ~ age + I(age^2), data = Wage)

Residuals:
    Min      1Q  Median      3Q     Max 
-99.126 -24.309  -5.017  15.494 205.621 

Coefficients:
              Estimate Std. Error t value            Pr(>|t|)    
(Intercept) -10.425224   8.189780  -1.273               0.203    
age           5.294030   0.388689  13.620 <0.0000000000000002 ***
I(age^2)     -0.053005   0.004432 -11.960 <0.0000000000000002 ***
---
Signif. codes:  0 '***' 0.001 '**' 0.01 '*' 0.05 '.' 0.1 ' ' 1

Residual standard error: 39.99 on 2997 degrees of freedom
Multiple R-squared:  0.08209,   Adjusted R-squared:  0.08147 
F-statistic:   134 on 2 and 2997 DF,  p-value: < 0.00000000000000022

Multiple predictors went to a bar: non-linear models

Show the code
ggplot(Wage, aes(age, wage)) +
      geom_point() +
      stat_smooth(method = "lm", 
                  formula = y ~ x + I(x^2), 
                  size = 1) + 
  theme_classic()
Warning: Using `size` aesthetic for lines was deprecated in ggplot2 3.4.0.
ℹ Please use `linewidth` instead.

Multiple predictors went to a bar: non-linear models

  • We could fit a model with a cubic term:
\[\begin{equation} Y = \beta_{0}+ \beta_{1}X + \beta_{2}X^2 + \beta_{2}X^3 + \epsilon \end{equation}\]
Show the code
ggplot(Wage, aes(age, wage)) +
      geom_point() +
      stat_smooth(method = "lm", 
                  formula = y ~ x + I(x^2) + I(x^3), 
                  size = 1) + 
  theme_classic()

Multiple predictors went to a bar: non-linear models

  • Let’s add more flexibility:
Show the code
ggplot(Wage, aes(age, wage)) +
      geom_point() +
      stat_smooth(method = "lm", 
                  formula = y ~ x + I(x^2) + I(x^3) + I(x^4)+ I(x^5), 
                  size = 1) + 
  theme_classic()

References

Field, A., Miles, J., & Field, Z. (2012). Discovering statistics using r. Sage publications.
Westfall, P. H., & Arias, A. L. (2020). Understanding regression analysis: A conditional distribution approach. Chapman; Hall/CRC.