Gentle introduction to R

Esteban Montenegro-Montenegro, PhD

Department of Psychology and Child Development

What is R?

R is a programming language mostly used in statistics. It was created by statisticians.

R was inspired by the statistical language S developed by At&T. S stands for “statistics” and it was written based on C language. After S was sold to a small company, S-plus was created with a graphical interface.

What is R (II)?

  • R was considered a “statistics” language, but nowadays it can perform more tasks. We will see examples where you can create a website, create a dashboard, create a teaching notebook, and presentation slides!

  • R also provides multiple options to create graphics and plots. The options are infinite when you use a programming language.

Why should we use R?

Why should we use R?

TIOBE index of R overtime

Why should we use R?

  • R is free and open-source software. R is available as Free Software under the terms of the Free Software Foundation’s GNU General Public License.
  • The amount of users grow every second.
  • It is friendly with non-programmers (You don’t believe me I know…).
  • The amount of packages is growing (19985 packages as today).
  • You don’t depend on buying a license.
  • You can see what is under the hood.
  • There are many jobs where R skills are needed.

  • You’ll have access to cutting-edge quantitative methods and models.

More info

See datacamp.com opinion.

How R works?

  • R is an interpreted language, that means you don’t need to compile the code. You will need to use a command-line interpreter.

  • It is an object-oriented programming language. It represents the information using virtual objects.

Packages are the key

  • R has several built-in functions but they are not enough to answer all the possible research questions a researcher will have.

  • R users support their data analysis using packages that other members of the community developed.

  • These packages are actually software and they can be installed very easily in R. You don’t have to program anything, there are 19 985 packages as today. But of course, you might need to program some routines if your problem is very specific.

  • The packages are all located in a large repository call Comprehensive R Archive Network (CRAN)

Let’s jump into R

Editors and IDE

Everything is an object, everything is a function

Types of objects

  • Objects in R have properties and names, similar to real objects:
    • vectors
    • data frame
    • lists
    • arrays
    • functions
  • These are just the most common objects in R. I’ll explain a little bit of each one.

Vectors

  • It is the most basic object, it is the bones of R.

  • In human language, they look like lists of elements. But, when mixed different type of data (letters mixed with numbers) things get messy:

### Let's create a vector with names:

randomNames <- c("Randall", "Pablo", "Emma")

print(randomNames) #You don't need to type print. This is for teaching purposes. 
[1] "Randall" "Pablo"   "Emma"   

Let’s see what happen’s when I mix numbers and letters:

numbersNames <- c("one",1, 2, "two", 3, "three")
print(numbersNames)
[1] "one"   "1"     "2"     "two"   "3"     "three"

R coerces everything to be a string or character vector.

  • You may also subset a vector by using [] as an index indicator
numbersNames[4]
[1] "two"

Data frames

  • Data frame is the most useful type of object when you conduct data analysis.

  • A data frame is several lists combined together, and it looks pretty much like a matrix or a spreadsheet:

Show the code
mtcars
                     mpg cyl  disp  hp drat    wt  qsec vs am gear carb
Mazda RX4           21.0   6 160.0 110 3.90 2.620 16.46  0  1    4    4
Mazda RX4 Wag       21.0   6 160.0 110 3.90 2.875 17.02  0  1    4    4
Datsun 710          22.8   4 108.0  93 3.85 2.320 18.61  1  1    4    1
Hornet 4 Drive      21.4   6 258.0 110 3.08 3.215 19.44  1  0    3    1
Hornet Sportabout   18.7   8 360.0 175 3.15 3.440 17.02  0  0    3    2
Valiant             18.1   6 225.0 105 2.76 3.460 20.22  1  0    3    1
Duster 360          14.3   8 360.0 245 3.21 3.570 15.84  0  0    3    4
Merc 240D           24.4   4 146.7  62 3.69 3.190 20.00  1  0    4    2
Merc 230            22.8   4 140.8  95 3.92 3.150 22.90  1  0    4    2
Merc 280            19.2   6 167.6 123 3.92 3.440 18.30  1  0    4    4
Merc 280C           17.8   6 167.6 123 3.92 3.440 18.90  1  0    4    4
Merc 450SE          16.4   8 275.8 180 3.07 4.070 17.40  0  0    3    3
Merc 450SL          17.3   8 275.8 180 3.07 3.730 17.60  0  0    3    3
Merc 450SLC         15.2   8 275.8 180 3.07 3.780 18.00  0  0    3    3
Cadillac Fleetwood  10.4   8 472.0 205 2.93 5.250 17.98  0  0    3    4
Lincoln Continental 10.4   8 460.0 215 3.00 5.424 17.82  0  0    3    4
Chrysler Imperial   14.7   8 440.0 230 3.23 5.345 17.42  0  0    3    4
Fiat 128            32.4   4  78.7  66 4.08 2.200 19.47  1  1    4    1
Honda Civic         30.4   4  75.7  52 4.93 1.615 18.52  1  1    4    2
Toyota Corolla      33.9   4  71.1  65 4.22 1.835 19.90  1  1    4    1
Toyota Corona       21.5   4 120.1  97 3.70 2.465 20.01  1  0    3    1
Dodge Challenger    15.5   8 318.0 150 2.76 3.520 16.87  0  0    3    2
AMC Javelin         15.2   8 304.0 150 3.15 3.435 17.30  0  0    3    2
Camaro Z28          13.3   8 350.0 245 3.73 3.840 15.41  0  0    3    4
Pontiac Firebird    19.2   8 400.0 175 3.08 3.845 17.05  0  0    3    2
Fiat X1-9           27.3   4  79.0  66 4.08 1.935 18.90  1  1    4    1
Porsche 914-2       26.0   4 120.3  91 4.43 2.140 16.70  0  1    5    2
Lotus Europa        30.4   4  95.1 113 3.77 1.513 16.90  1  1    5    2
Ford Pantera L      15.8   8 351.0 264 4.22 3.170 14.50  0  1    5    4
Ferrari Dino        19.7   6 145.0 175 3.62 2.770 15.50  0  1    5    6
Maserati Bora       15.0   8 301.0 335 3.54 3.570 14.60  0  1    5    8
Volvo 142E          21.4   4 121.0 109 4.11 2.780 18.60  1  1    4    2

Let’s beautify the data frame output:

Show the code
library(DT)
datatable(mtcars,
          rownames = TRUE) 

Lists

  • Lists are flexible and easy to manipulate in R. You can combine different types of objects in a single list:
Show the code
### Let's create different types of objects

### Data frame

data_1 <- data.frame(v1= rnorm(8),
                     v2 = rnorm(8),
                     v3 = rnorm(8))

### Vector

moreNames <- c("Bob", "Paris", "Ana")

### Numeric vector

numericVector <- c(1,3,78,90)

### We can group all these objects in a list

listOfObjects <- list(data_1,
                      moreNames,
                      numericVector)
print(listOfObjects)
[[1]]
          v1         v2           v3
1 -1.3846711  1.1342249  0.005603773
2 -0.6052452  1.7357052  0.157493762
3  1.1978363 -0.7972630  0.926481685
4  0.6755754  0.6163520  0.439208389
5 -1.0040656 -0.7112245 -0.668112481
6 -1.0667921 -0.4581647  0.228805642
7  2.1765713  0.7218299 -0.503185122
8  0.7557314  1.5541713 -0.714680298

[[2]]
[1] "Bob"   "Paris" "Ana"  

[[3]]
[1]  1  3 78 90

If you need to access one object in the list you may use its location plus [[]]:

Show the code
listOfObjects[[2]]
[1] "Bob"   "Paris" "Ana"  

Arrays

  • I don’t use arrays in my code, but they are common in in R and other languages.

  • An arrays is a multidimensional object, you can have multiple “slices” of information in on single object.

  • It is similar to a multi-layer object.

array(c(matrix(1:4,2,2)), dim=c(2,2,3))
, , 1

     [,1] [,2]
[1,]    1    3
[2,]    2    4

, , 2

     [,1] [,2]
[1,]    1    3
[2,]    2    4

, , 3

     [,1] [,2]
[1,]    1    3
[2,]    2    4

Functions

  • A function is a data object that requires input information, in return; it will give an output.

  • I have already used several functions (e.g. data.frame(), rnorm()).

  • Functions will always follow the following structure:

myFunction <- function(argument1, argument2, ...){ 
  
  operation
  
  return()
  
  }
  • We can study the following case, where I created a function to estimate your age:
Show the code
estimateAge <- function(myBirthday) {
  ### Function to check if year is a
  ### leap year.
  
  leapyear <- function(year) {
    return(((year %% 4 == 0) & (year %% 100 != 0)) | (year %% 400 == 0))
  }
  
  ### Information necessary to compute age
  myBirthday2 <- as.Date(myBirthday)
  today <- Sys.Date()
  year <- as.numeric(format(myBirthday2, "%Y"))
  leapCheck <- leapyear(year)
  
  
  if (leapCheck == TRUE) {
    ## leap year
    age <- difftime(today,
                    myBirthday2 ,
                    units = "days") / (365 + 1)
    
  } else {
    ## No leap year
    age <- difftime(today,
                    myBirthday2,
                    units = "days") / 365
    
  }
  
  message("Your age is"," ", age)
}
  • My function estimateAge() requires only one argument myBirthday, that argument is passed to the computation inside the function to estimate the age.
## Let's enter my date of birth
estimateAge("1986-01-28") 
Your age is 37.8027397260274
  • But don’t worry, you don’t have to compute age like I did. There is already a package that has all the tools to manipulate dates. It is the package lubridate.

More applications beyond statistics

ShinyApps

Web Pages

- Andrew Heiss

- Quantum Jitter

- Ella Kaye

- Books

- University Course

Scientific articles and reports in pdf

- Article

- Report

We can also add R code and run it in our websites

We can paint happy plots in R

Happy penguins

Show the code
### The rule is to write the packages required by your code at the beginning
## Packages loaded or called
library(jpeg)             ## reads pictures into R
library(patchwork)         ## more tools to add features in a plot
library(ggplot2)          ## creates plots
library(palmerpenguins)  ## This package has the penguin data

picture <- "penguins.jpg"
img <- readJPEG(picture, native = TRUE)

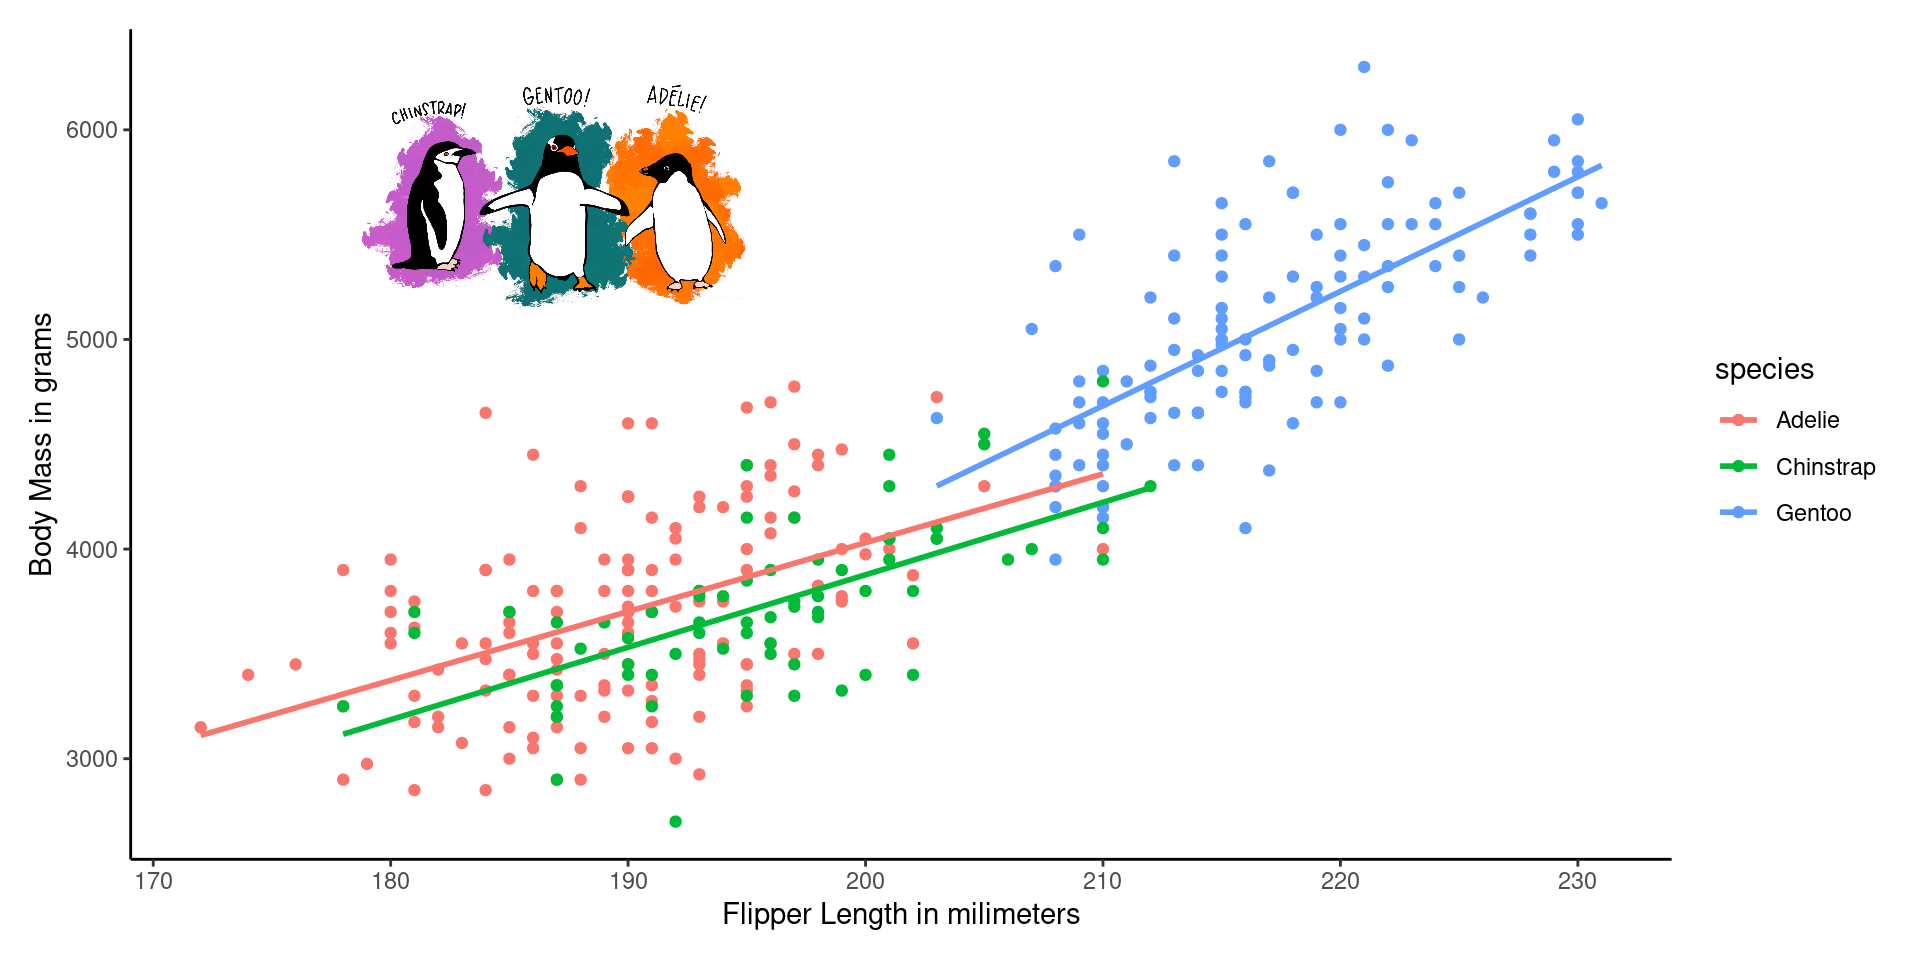
### Plotting the data using ggplot2

ggplot(penguins, aes(x = flipper_length_mm, 
                     y= body_mass_g,
                     color = species)) +
  geom_point() + 
  geom_smooth(se = FALSE, method = "lm" ) + 
  theme_classic() +  
  xlab("Flipper Length in milimeters")+
  ylab("Body Mass in grams")+
  inset_element(p = img,
                left = 0.05,
                bottom = 0.65,
                right = 0.5,
                top = 0.95)

You can create art

GIS and spatial data

Making Middle Earth maps with R

Remember…

Thank you for you attention!

Follow me on Mastodon.

emontenegro1@csustan.edu