Norms and Basic Statistics for Testing
Gentle introduction
Why do we need stats when creating measurements ?
- There are many reasons to implement statistical models in measurement theory.
- We need to create statistical models that help to understand Nature.
- In order to understand Nature we need to create instruments and measurements.
- The best way to create measurements is to create a model where observation and theory are linked together. In this step, statistics will help us to evaluate a model or multiple measurement models.
- Statistics will help to make inferences based on our observed data.
- You can describe the performance of groups, or describe traits with aggregated data.
- You can compare individuals and groups based on scores.

Wait… what is a statiscal model ?
To study and understand Nature we must construct a model for how Nature works.
A model helps you to understand Nature and also allows you to make predictions about Nature. There is no right or wrong model; they are all wrong! But some are better than others.

Types of Scales
- Nominal: numerical values representing labels or groups. For example: marital status, job position, gender.
- Ordinal: This scale allows you to rank individuals or objects but not to say anything about the meaning of the differences between the ranks. Likert scales are a good example.
- Ratio: it is a scale with a meaningful zero. For example the Kelvin scale to measure temperature.

Descriptives a probability distributions
You are probably familiar with frequencies. When reporting frequencies, we count how many times a value is repeated in your observed data.
In the next example I’ll show descriptive information related to a validation I did in Costa Rica.
My aim was to know how people felt when reading different adjectives and nouns. I asked to my participants to rate the perceived “arousal” and perceived “valance” of each word.
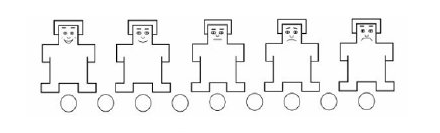
I utilized mannequins to evaluate valance:
- I used the following scale to measure arousal:
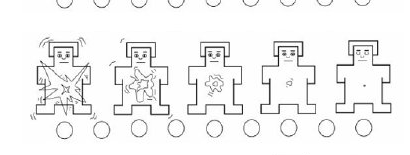
I didn’t create these scales, the original authors are Bradley & Lang (1994), an it was called The Self-Assessment Manikin. I thought it could be a good option to measure words’ positive and negative valence along with the “arousal”.
Each little individual scale had a number in my data set, the first little guy in each scale was coded as “9” and the last little individual was coded as “1”.
This means I utilized an ordinal scale where 9 represents “very positive word”, and 1 represents “very negative word”. Likewise, in the arousal scale 9 represents “strongly activated” whereas 1 represents “calm or not activated”.
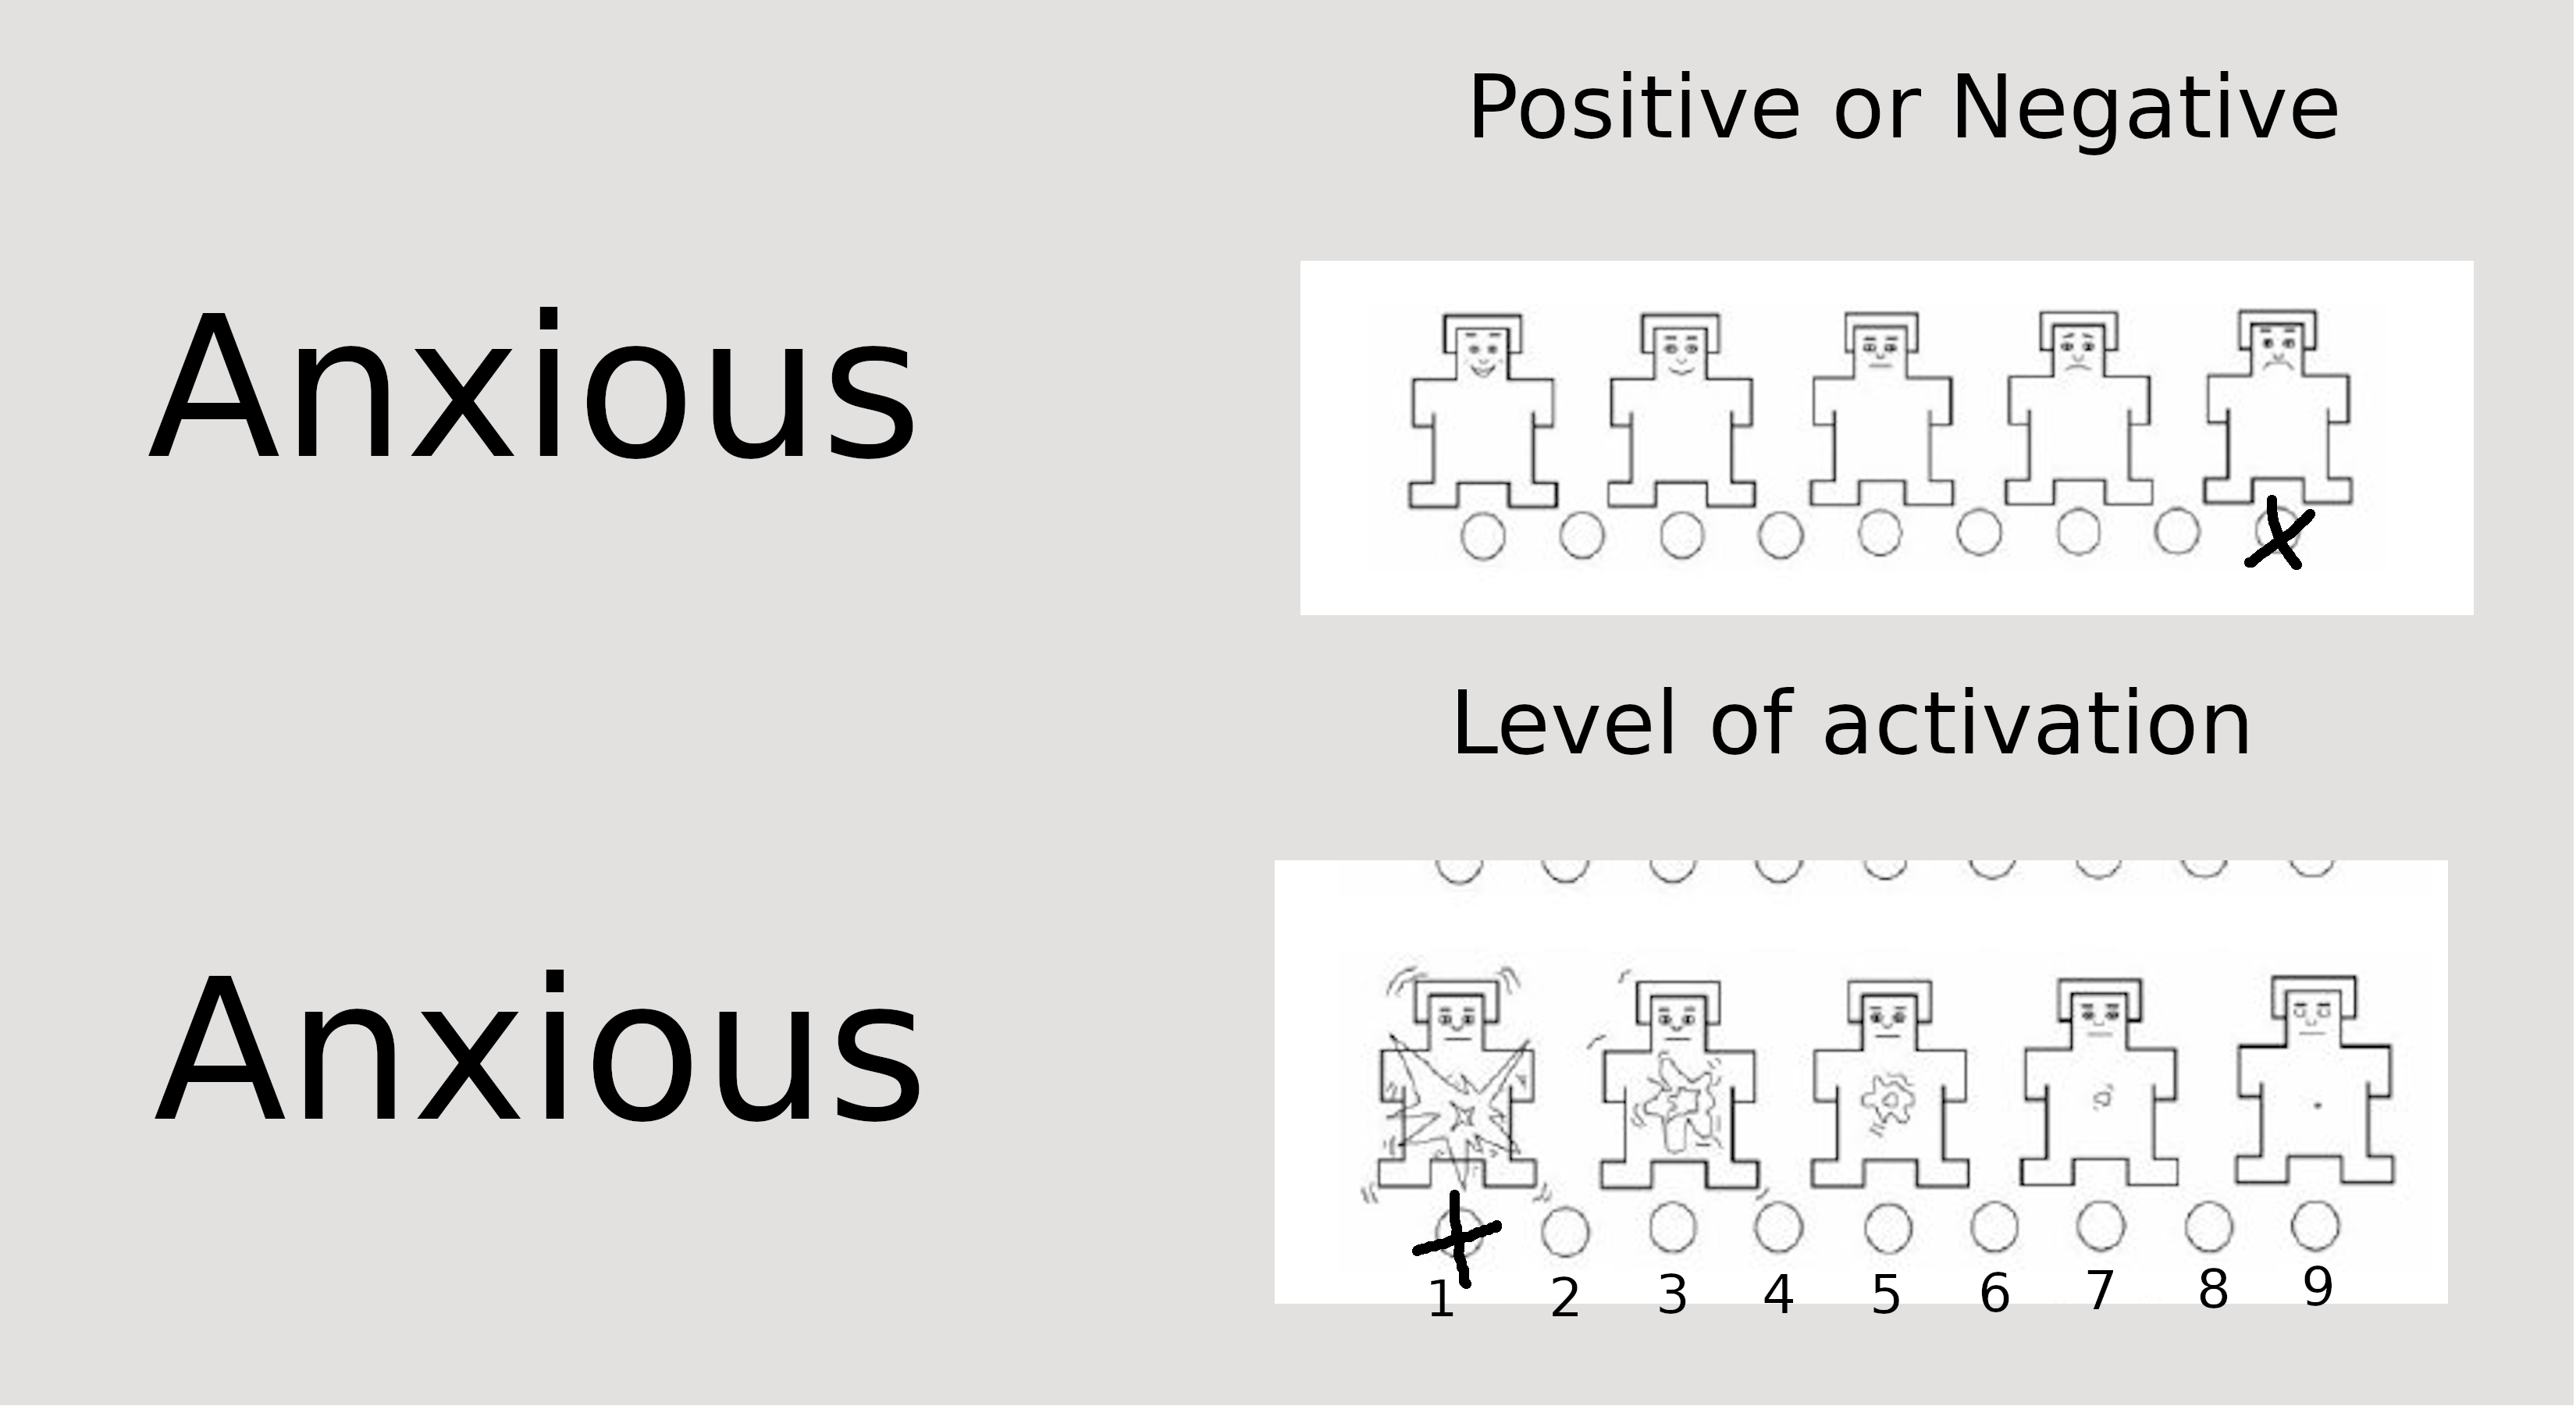
SAM instrument
- In this example a person marked rated “Anxious” “1” in valance and “9” in activation.
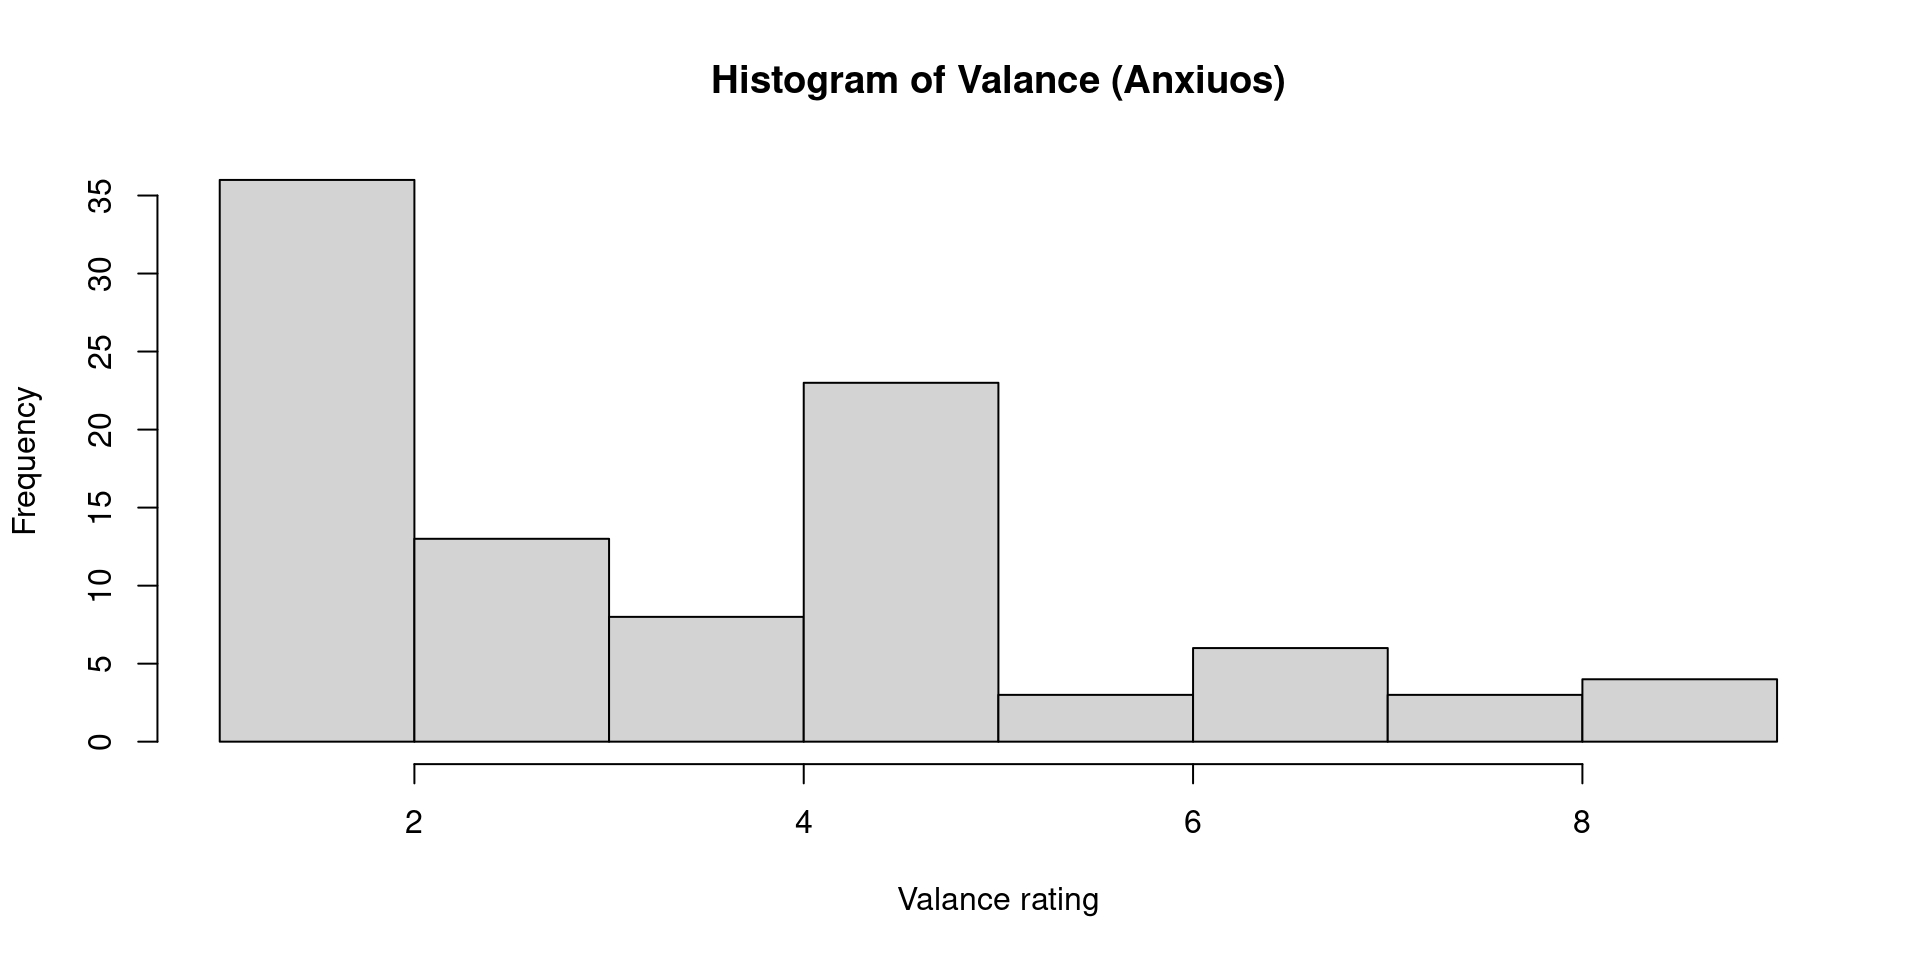
Let’s see some distibutions and frequencies

Percentiles
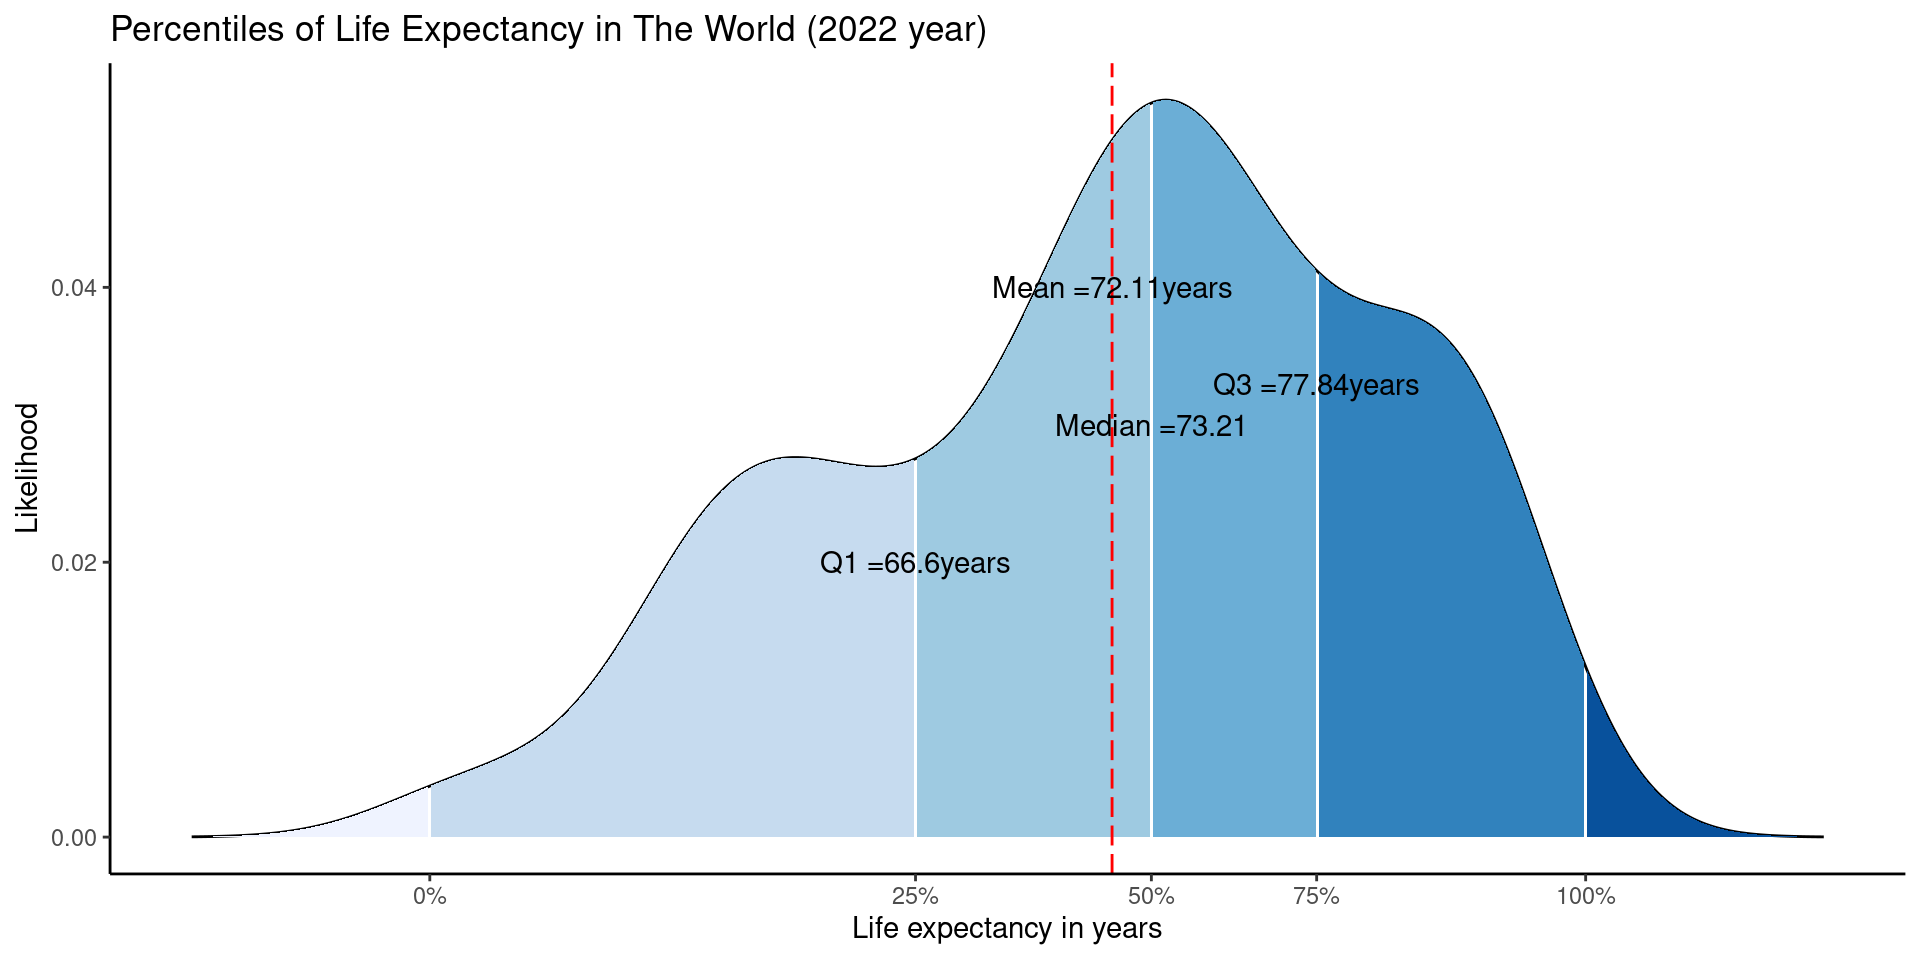
Source: CLICK HERE
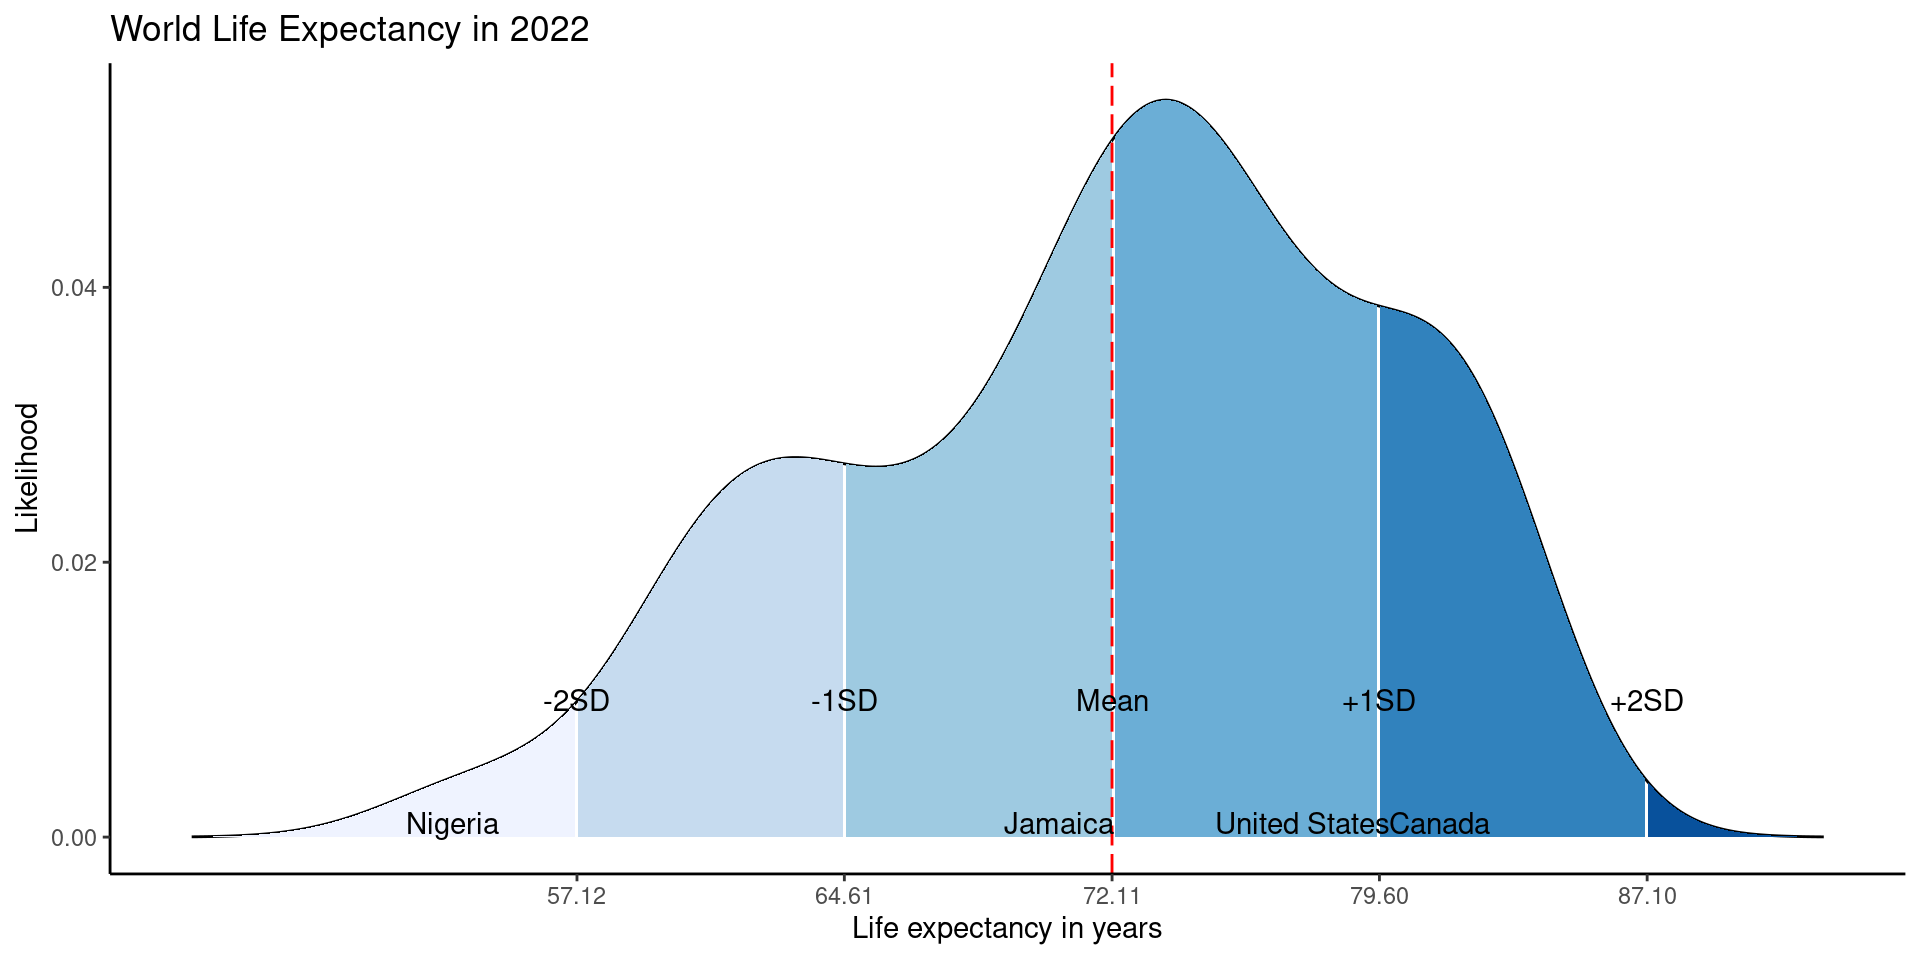
Mean and Standard deviation
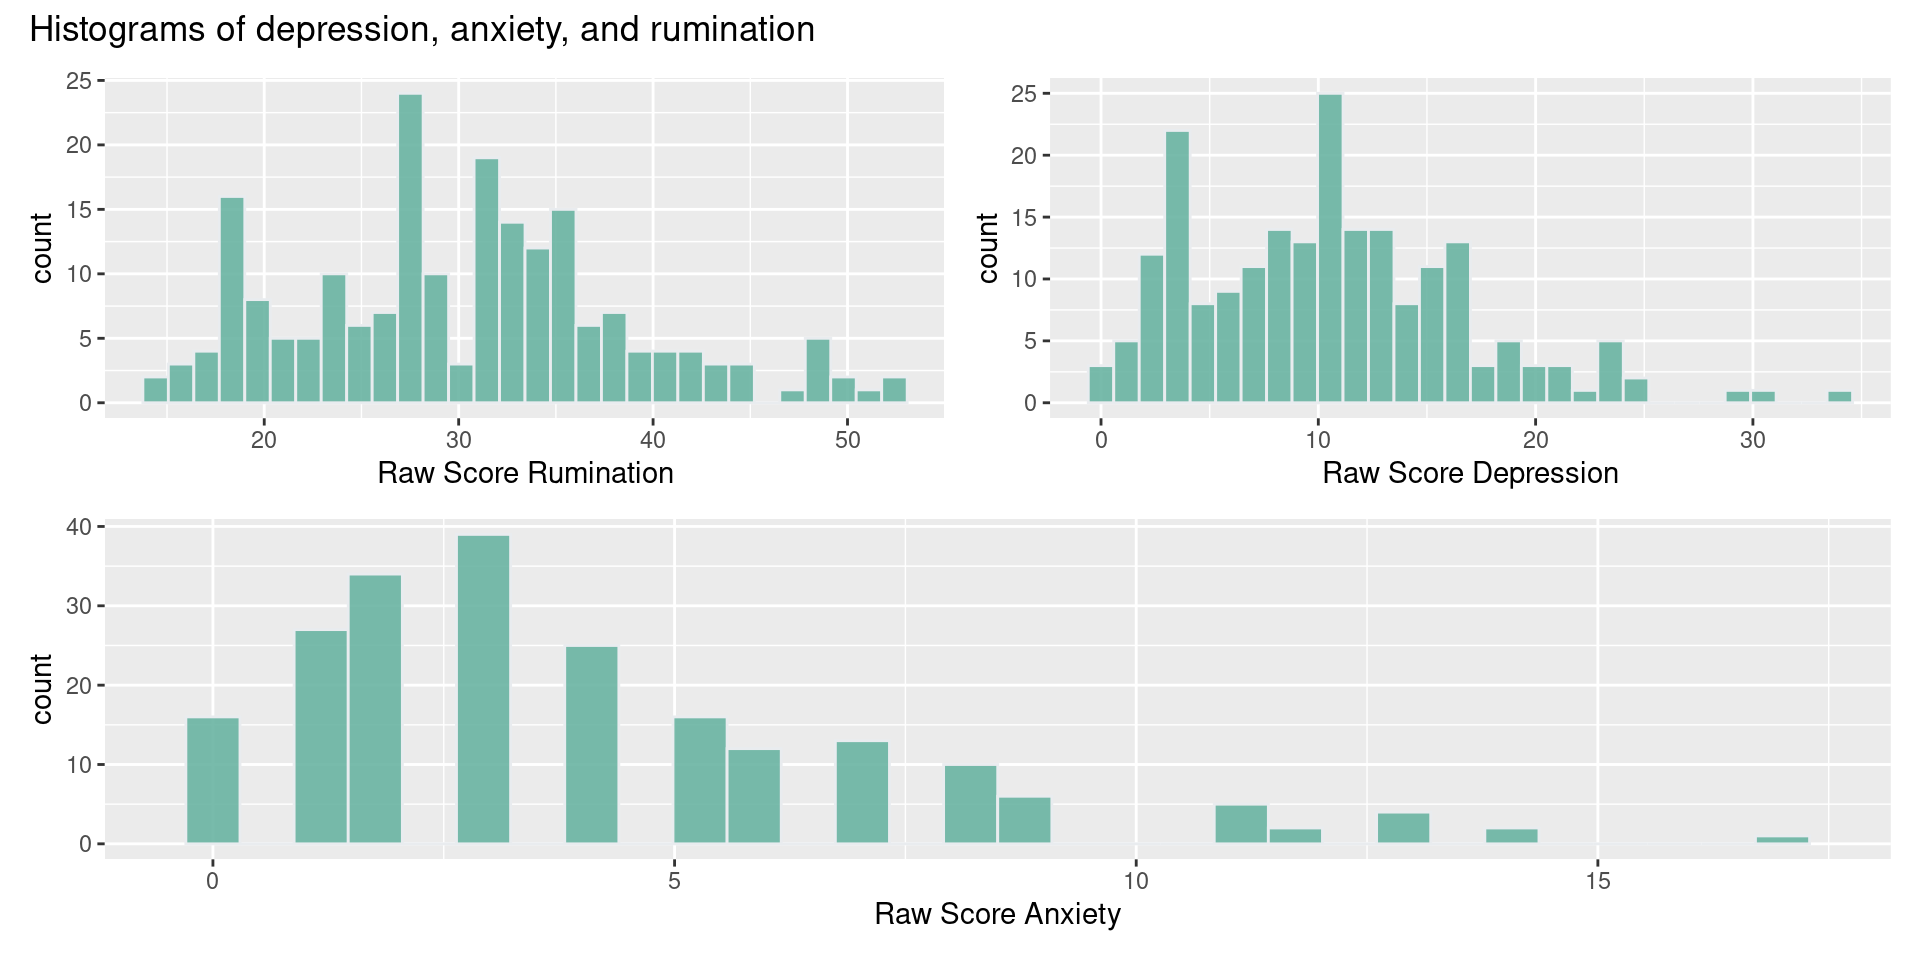
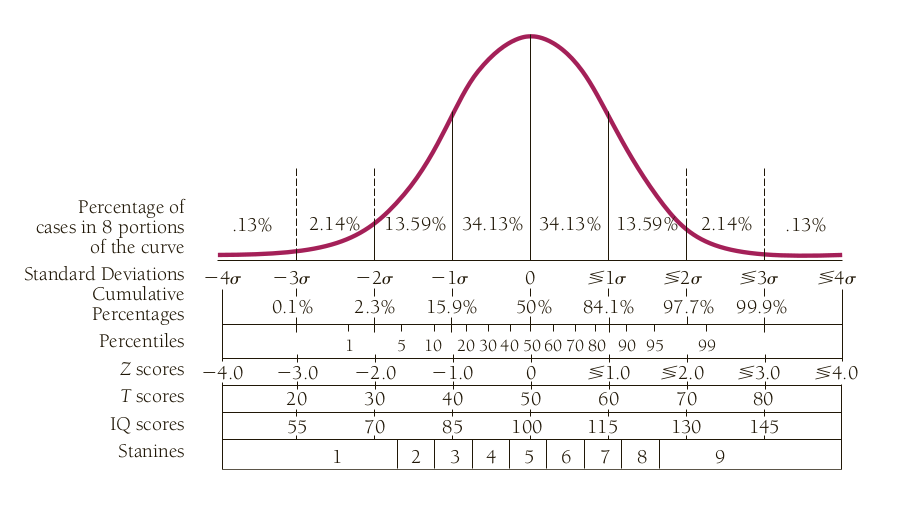
Z-Scores
Z Scores are used to compare observed scores versus a normative score, or to compare scores from different scales with different metric.
Let’s see an example where we need to compare two scores, but the scores have different range of values:
| Variable | N = 175 |
|---|---|
| depressionTotal | |
| Mean (SD) | 10 (6) |
| Min, Max | 0, 34 |
| anxietyTotal | |
| Mean (SD) | 4.1 (3.3) |
| Min, Max | 0.0, 17.0 |
| ruminationTotal | |
| Mean (SD) | 30 (8) |
| Min, Max | 14, 52 |
We’ll need to compute Z scores in these cases using the following transformation:
\[Z = \frac{X_{i}-\bar{X}}{SD}\]
In this transformation we estimate the distance from the mean (\(\bar{X}\)) for each observed value \(X_{i}\), and then we divide it by the score’s standard deviation (\(SD\)).
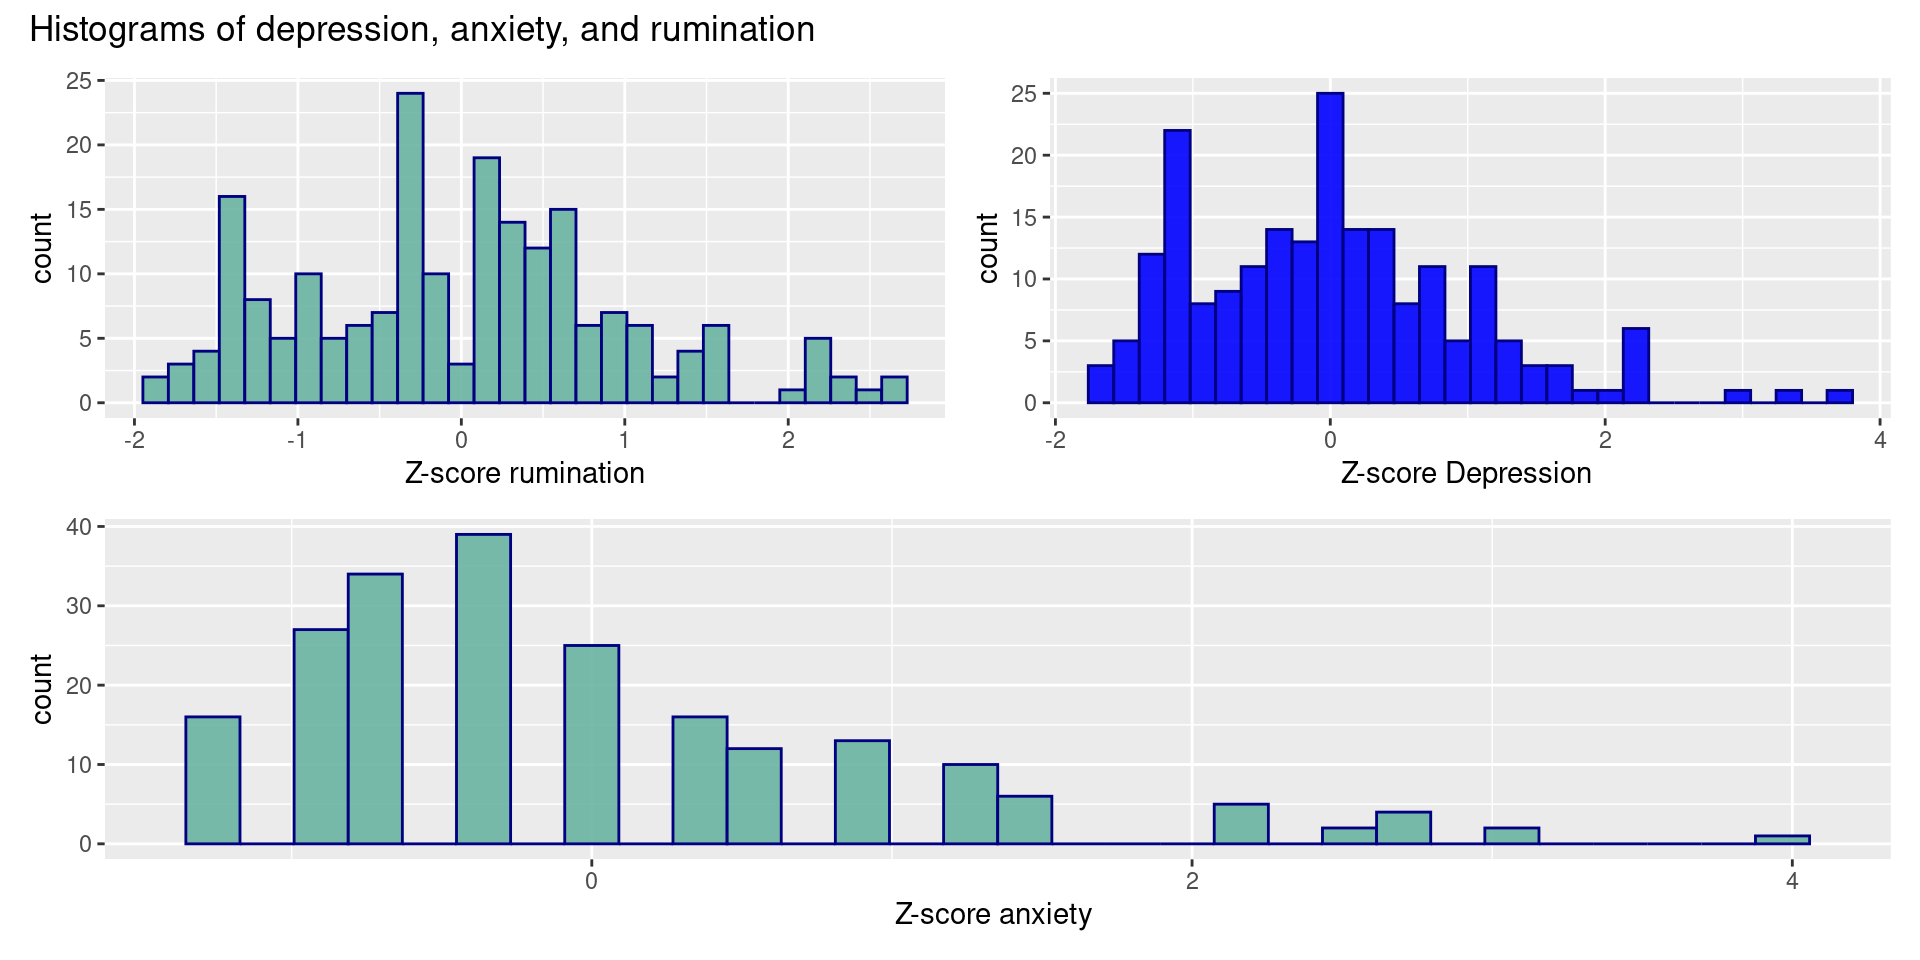
Z-Scores
- After tranforming the observed values, we can now compare distributions:
| Variable | N = 175 |
|---|---|
| depreZ | |
| Mean (SD) | -0.01 (1.00) |
| Min, Max | -1.65, 3.72 |
| anxietyZ | |
| Mean (SD) | 0.00 (1.02) |
| Min, Max | -1.26, 3.97 |
| rumiZ | |
| Mean (SD) | 0.00 (1.00) |
| Min, Max | -1.93, 2.59 |
Norms and Norming
References
![]()

Bradley, M. M., & Lang, P. J. (1994). Measuring emotion: The self-assessment manikin and the semantic differential. Journal of Behavior Therapy and Experimental Psychiatry, 25(1), 49–59.
Westfall, P. H., & Henning, K. S. (2013). Understanding advanced statistical methods. CRC Press Boca Raton, FL, USA: