Correlation and Regression Models
Part 1
Correlation interpretation and other features
Salkind & Shaw (2020):
Correlation interpretation and other features (cont.)
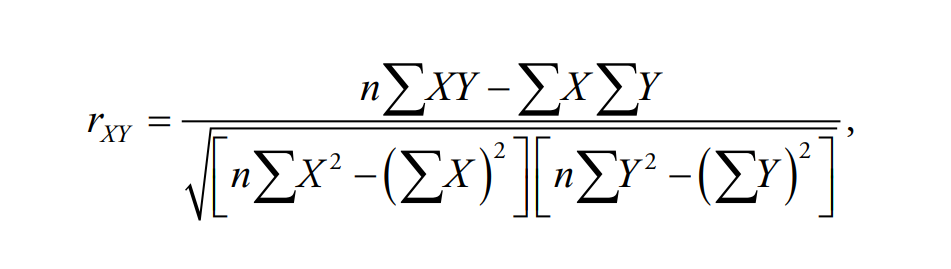
\(r_{xy}\) is the correlation coefficient.
\(n\) is the sample size.
\(X\) represents variable \(X\).
\(Y\) represents variable \(Y\).
\(\Sigma\) means summation or addition.
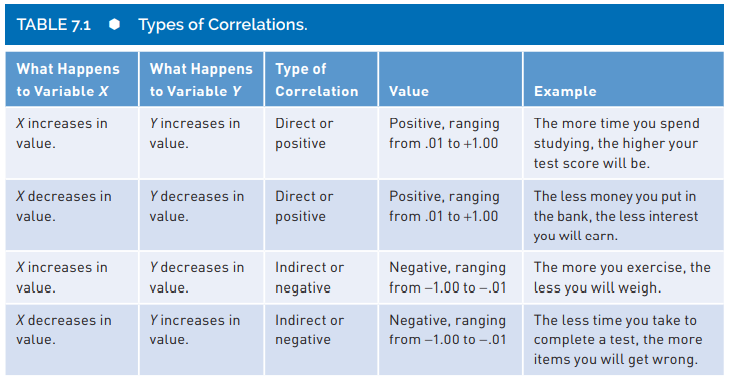
Let’s take a look at positive correlations
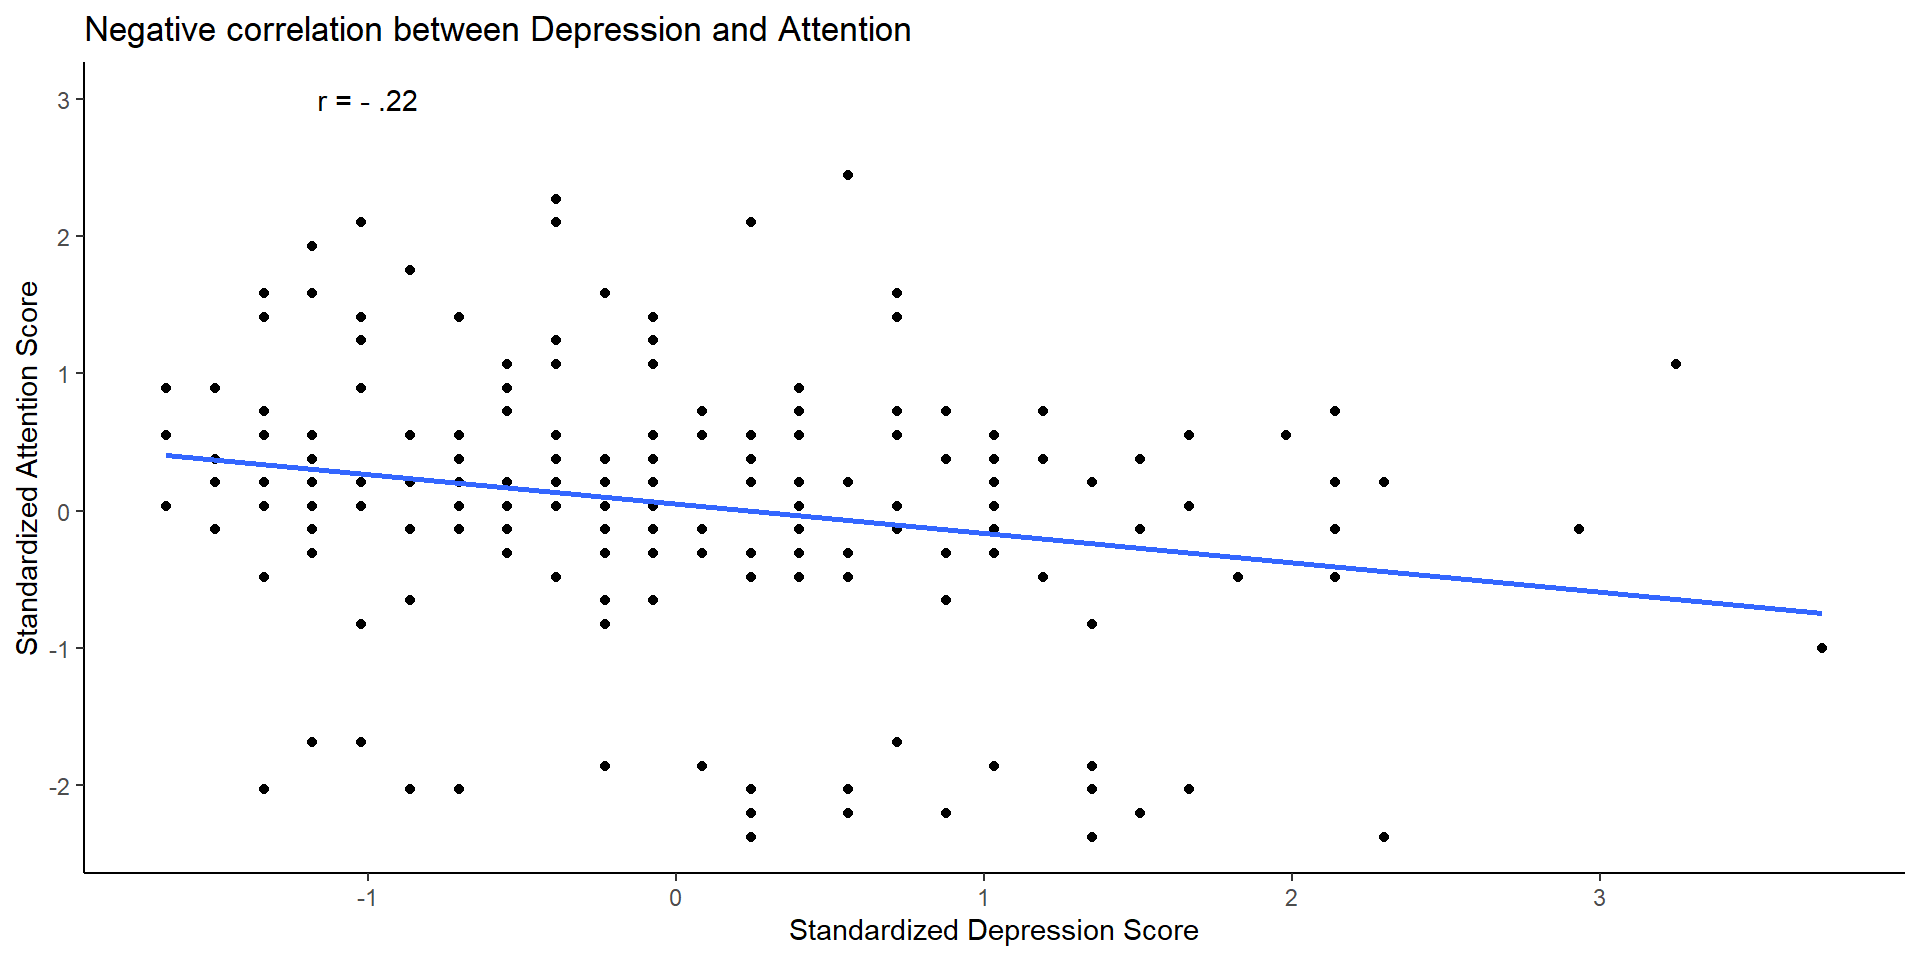
Let’s take a look at negative correlations (cont.)
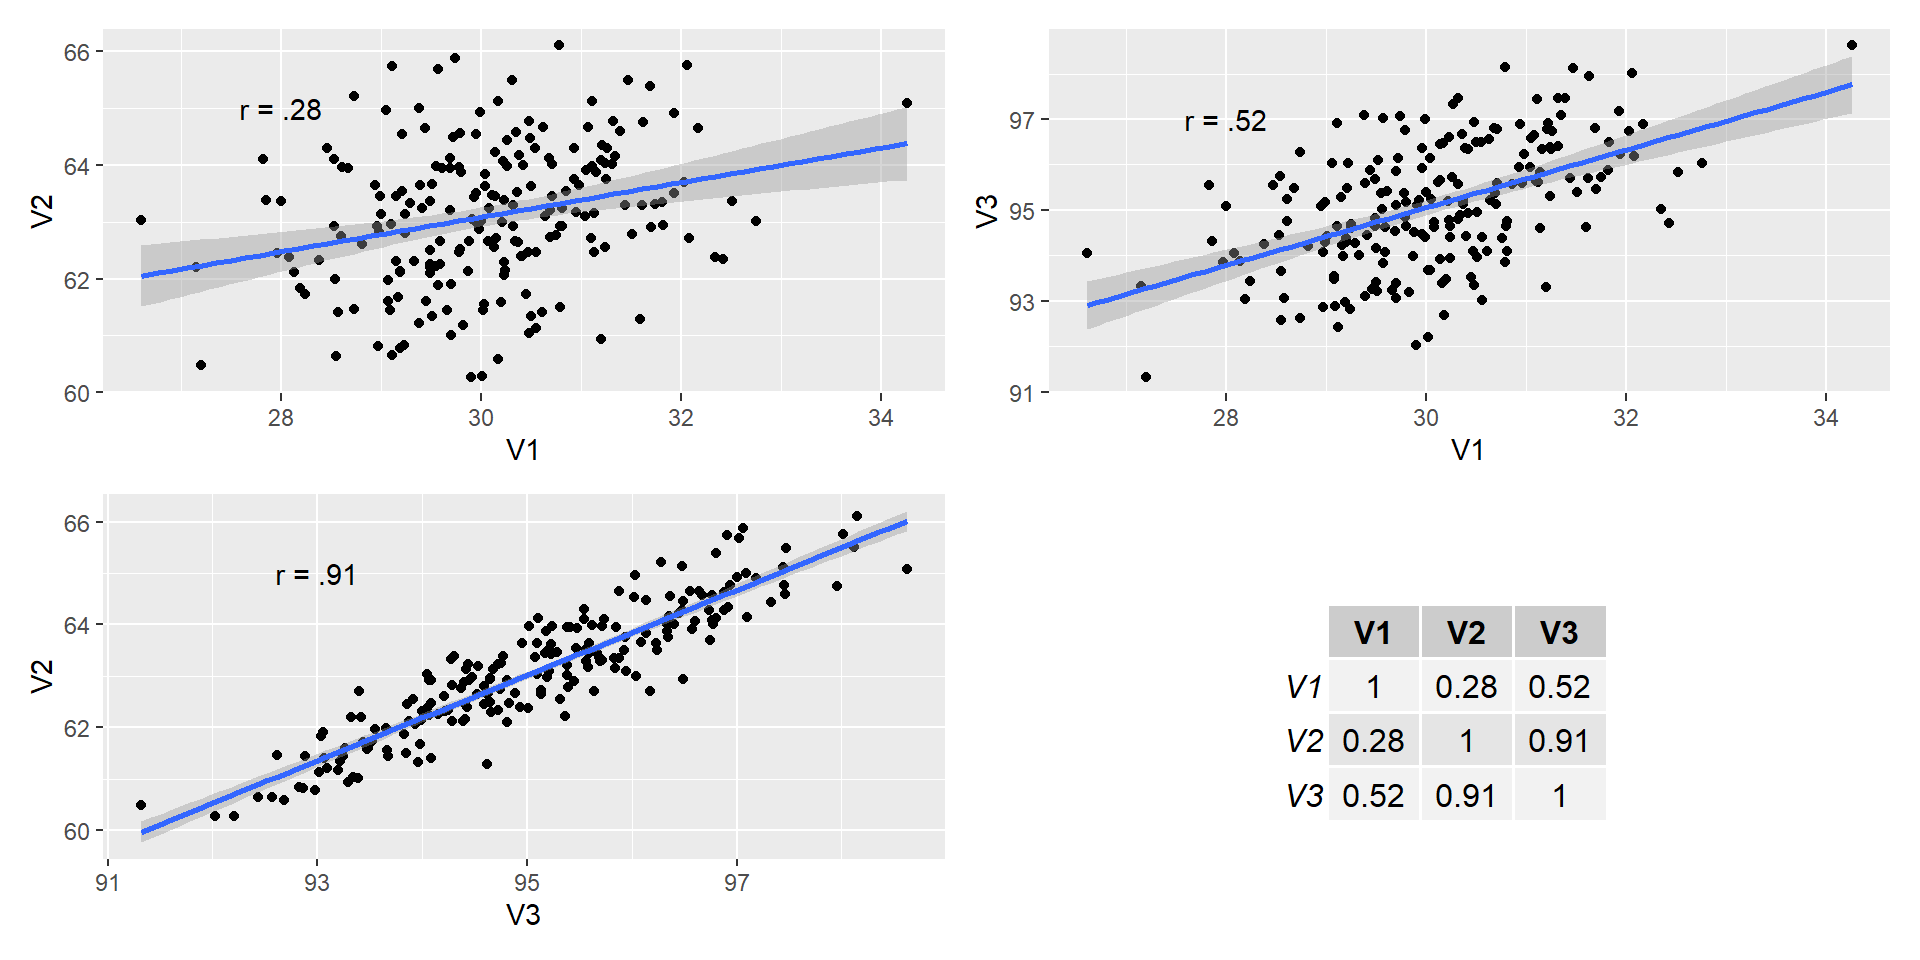
Correlation matrix
Salkind & Shaw (2020):
- You will find a correlation matrix in publications.
- It is the best way to represent several correlations between different pairs of variables.
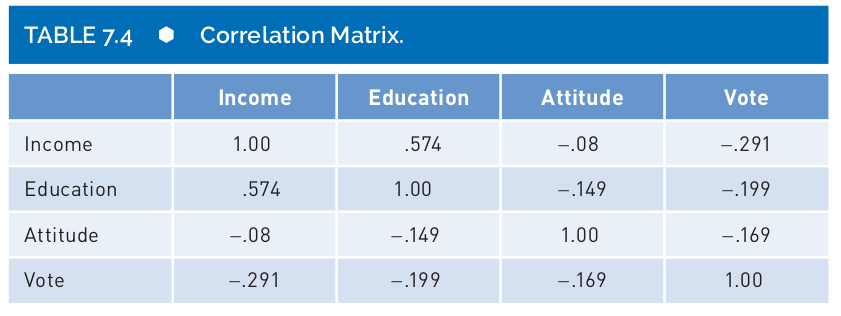
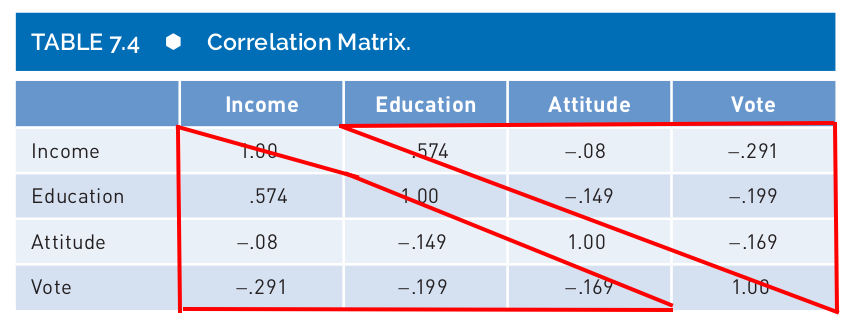
- You will notice that a a correlation matrix has 1.00 on the diagonal and two “triangles” with the same information.
Coefficient of Determination
- There is a useful trick, you could square your \(r\) and get a measure of correlation in terms of percentage of shared variance:
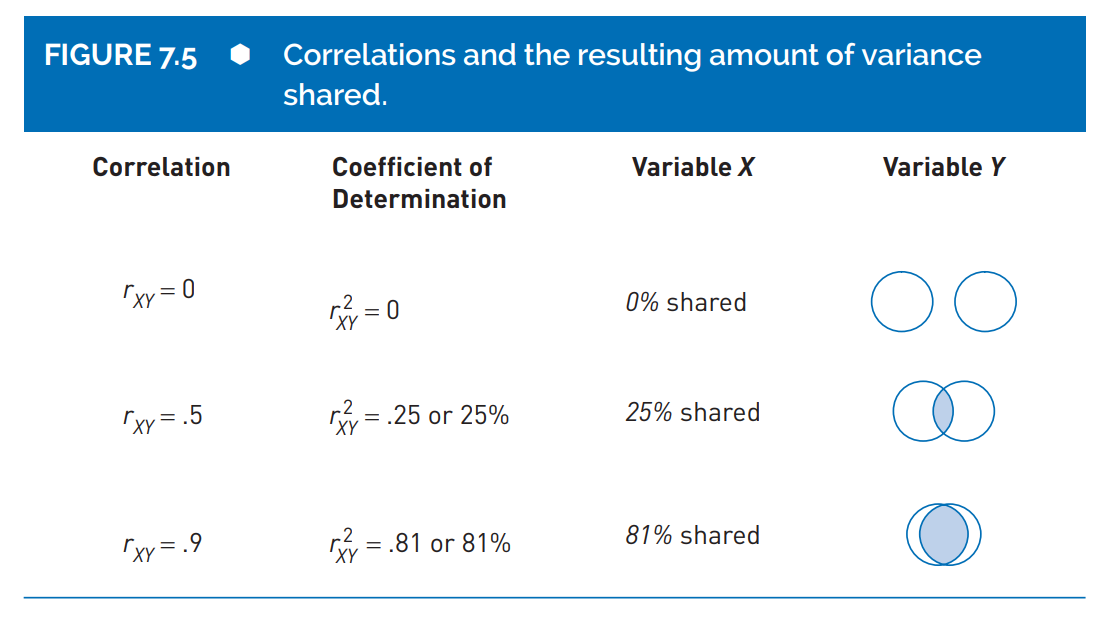
Coefficient of Determination (cont.)
What is the coefficient of determination in this case?
We just need to estimate $ r^2= -0.22^2 = -0.05\(. Attention and depression shared only 5\)%$ of the variability (variance).
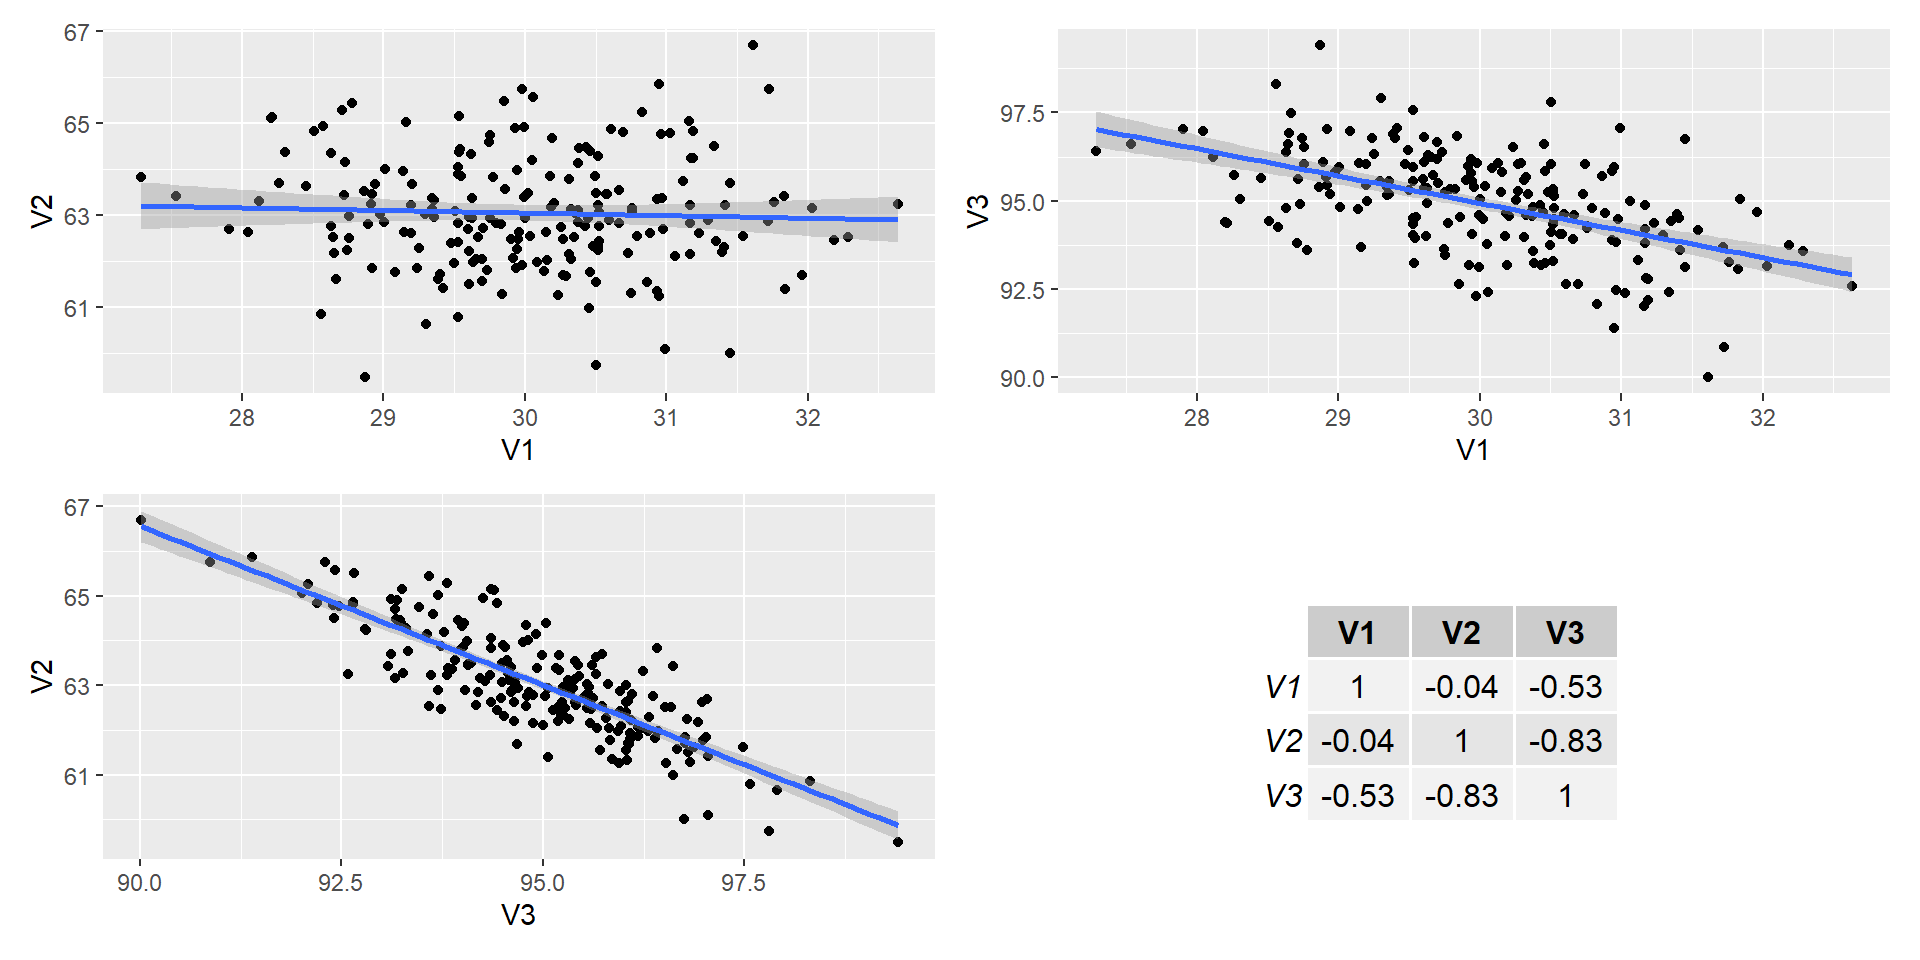
Scatter plots and direction of correlation (cont.)
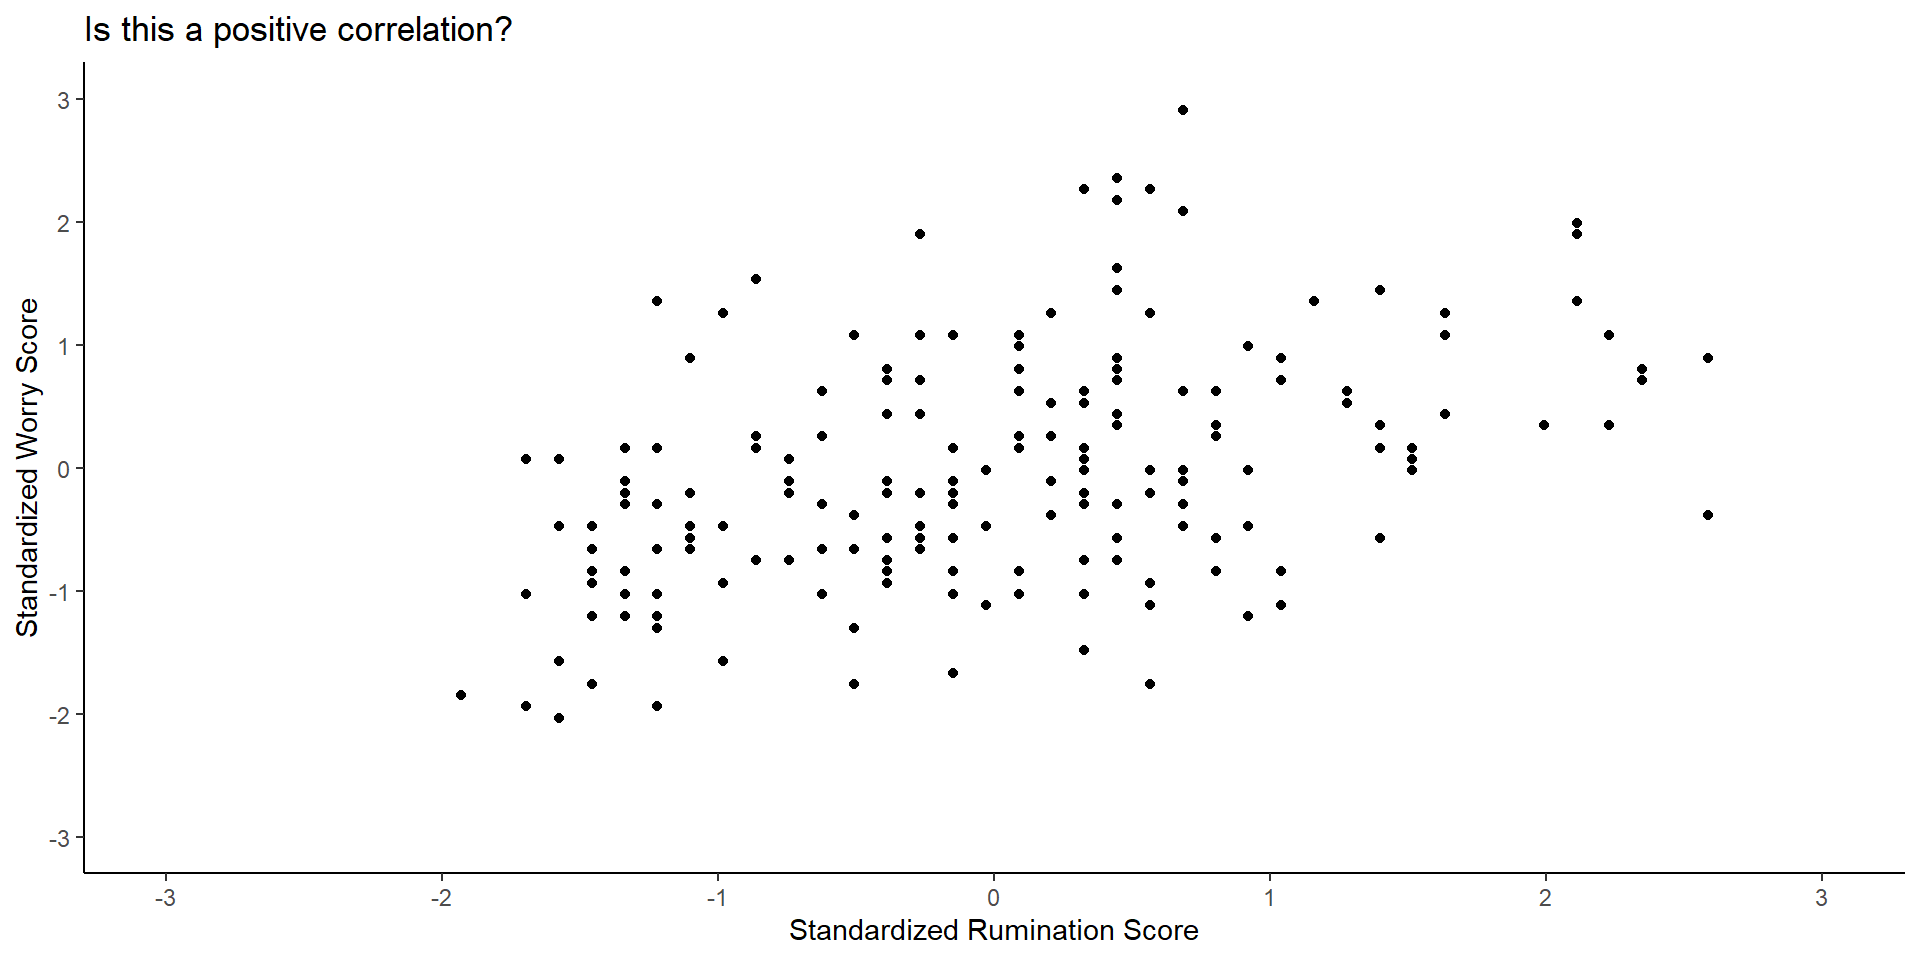
Scatter plots and direction of correlation (cont.)
- We can check some values and see what is happening, like case #78, in the next plot:
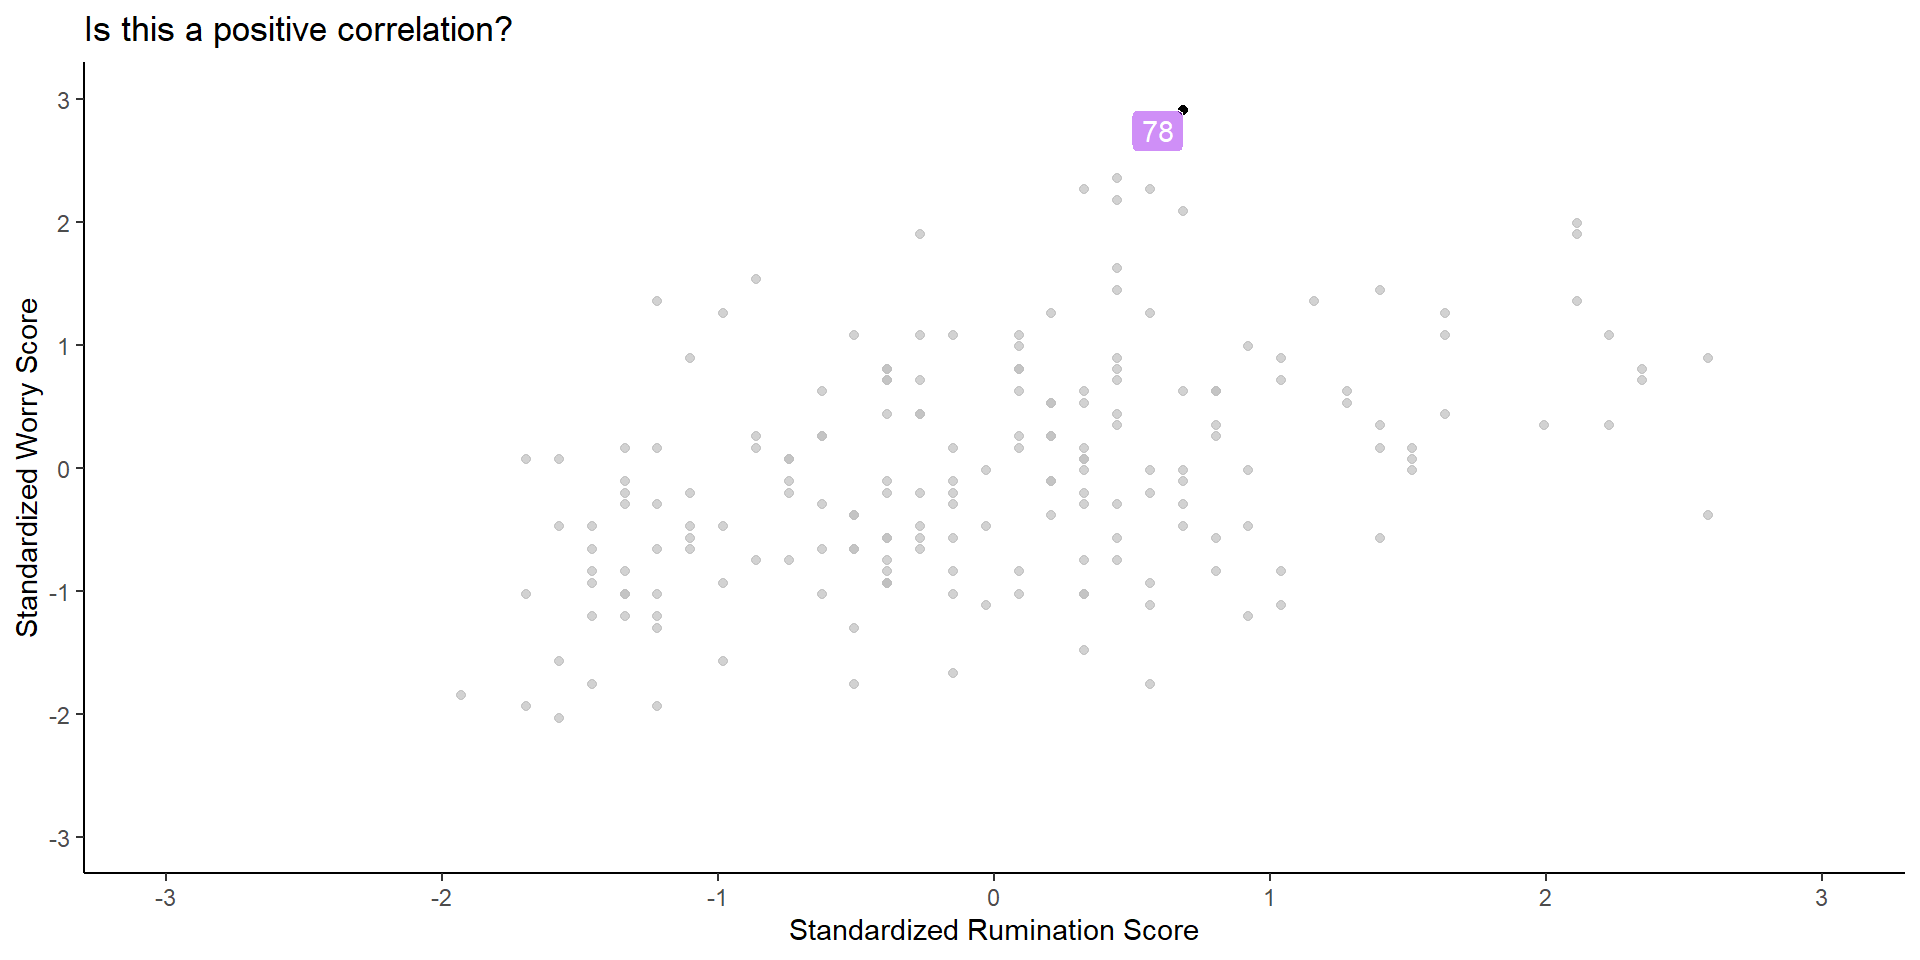
Scatter plots and direction of correlation (cont.)
- Maybe if we add the line of best fit we will see it better:
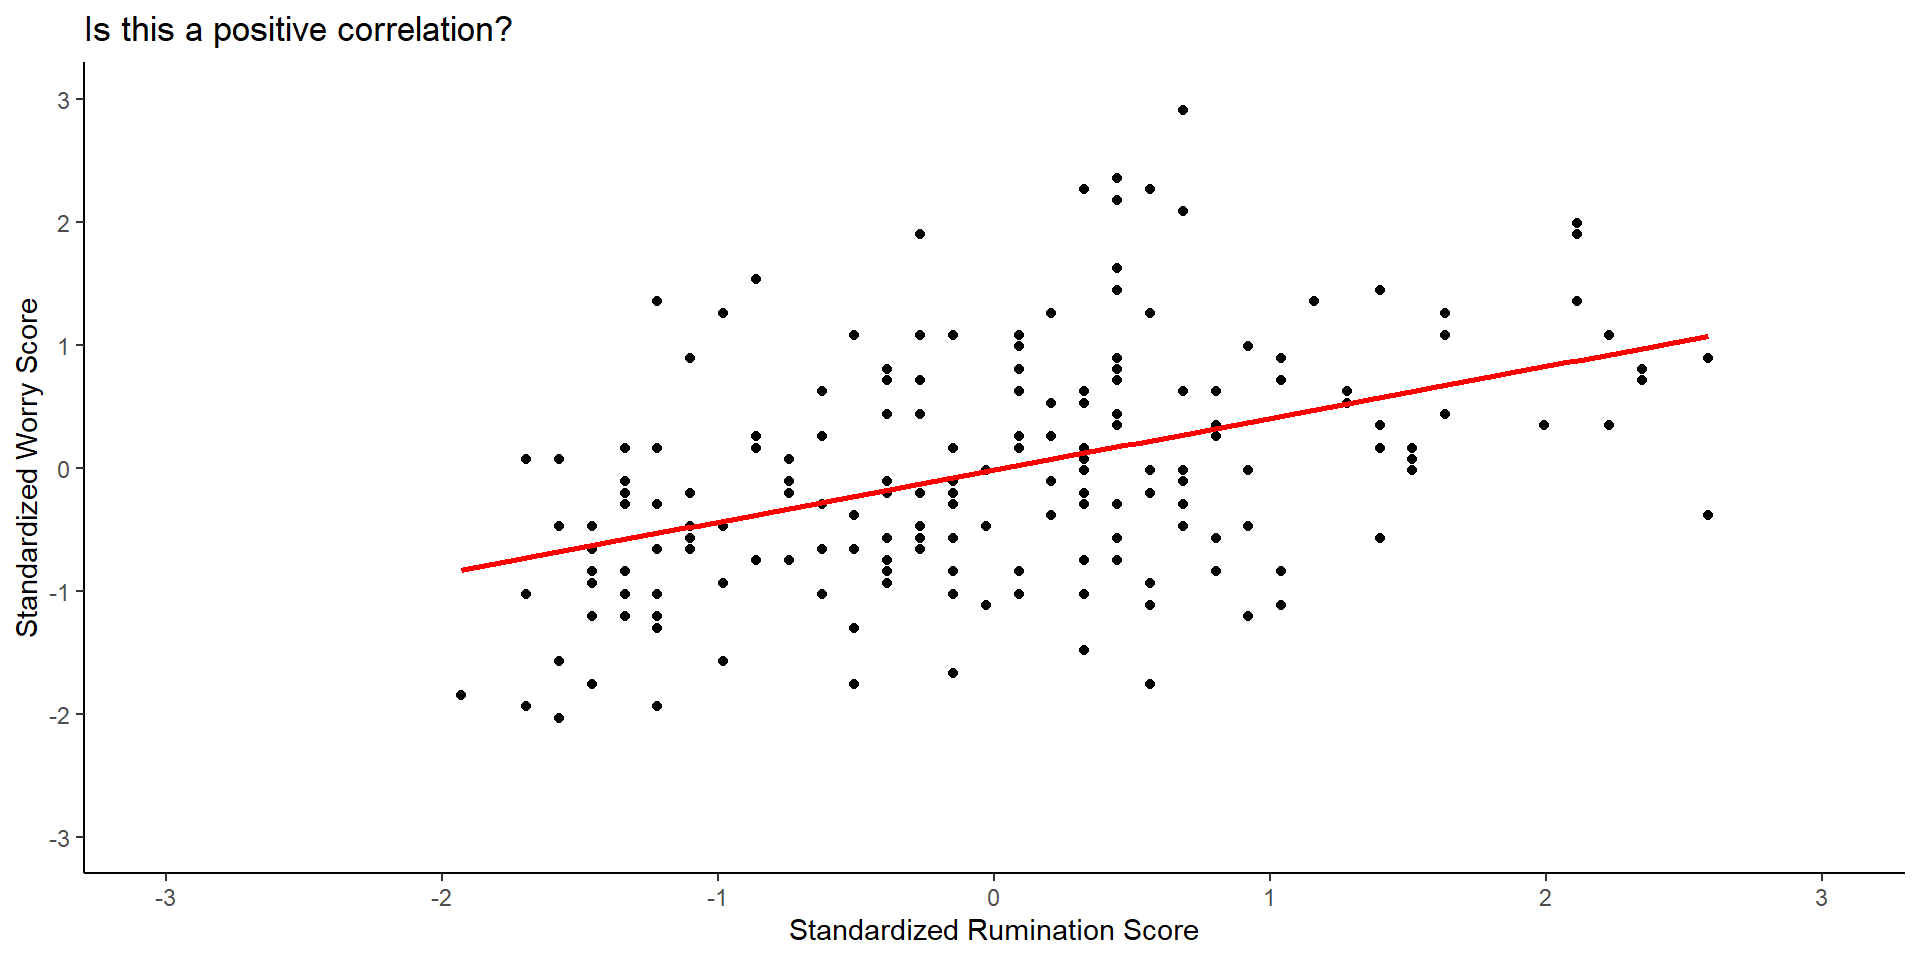
Scatter plots and direction of correlation (cont.)
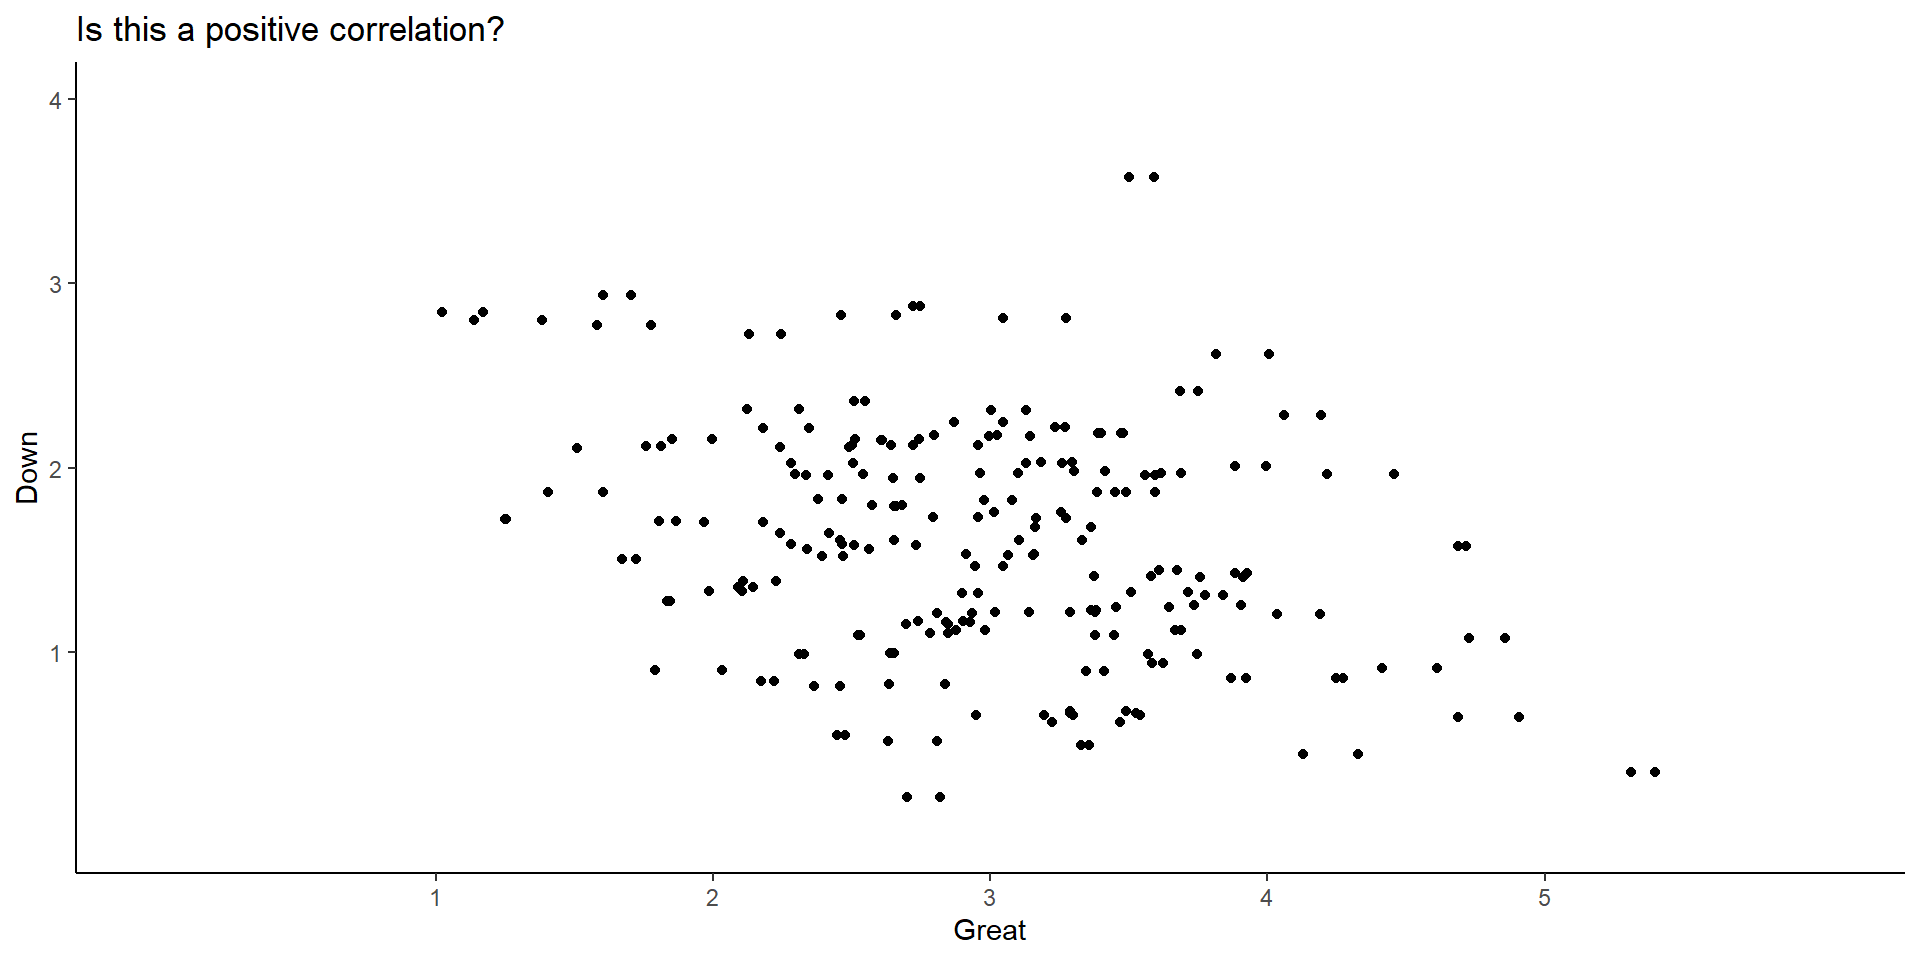
Can you spot the direction of this correlation?
This data come from a questionnaire that asks to rate how emotional you feel. For instance, it asks: Rate how GREAT you feel where 1 = “not feeling” to 6=“I strongly feel it”.
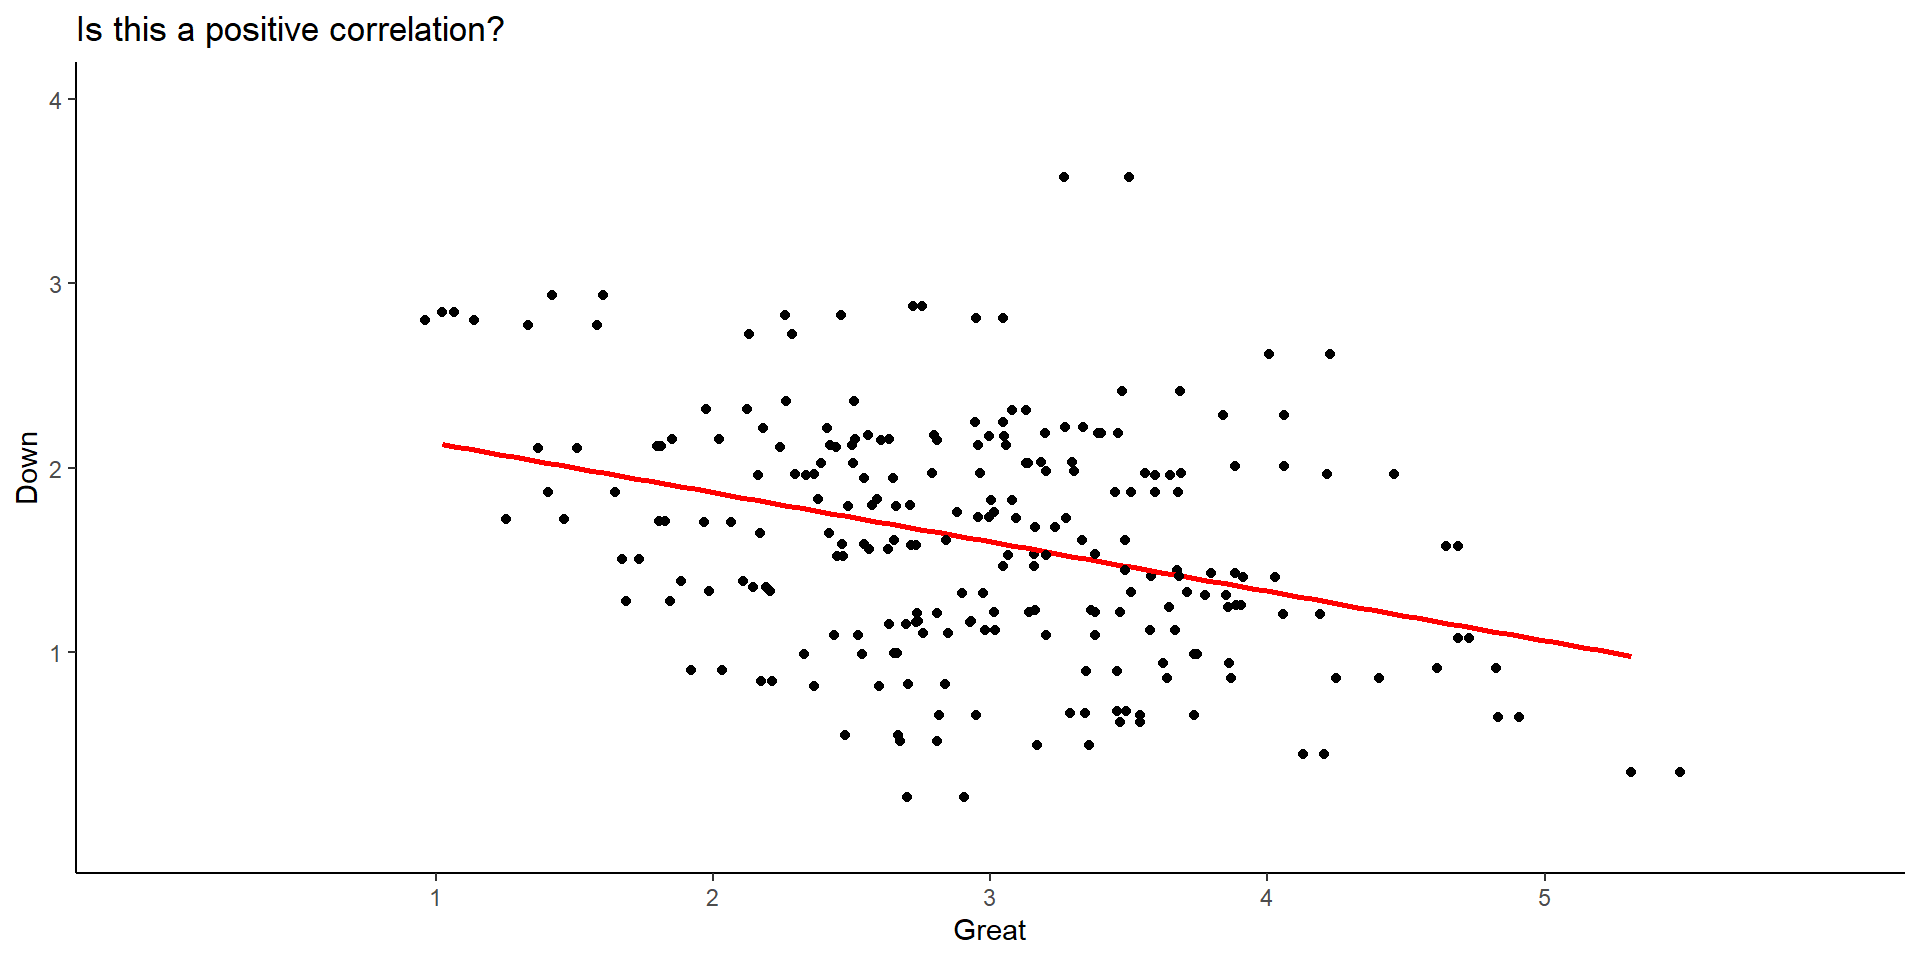
Scatter plots and direction of correlation (cont.)
- Let’s add again the line of best linear fit:
Scatter plots and direction of correlation (cont.)
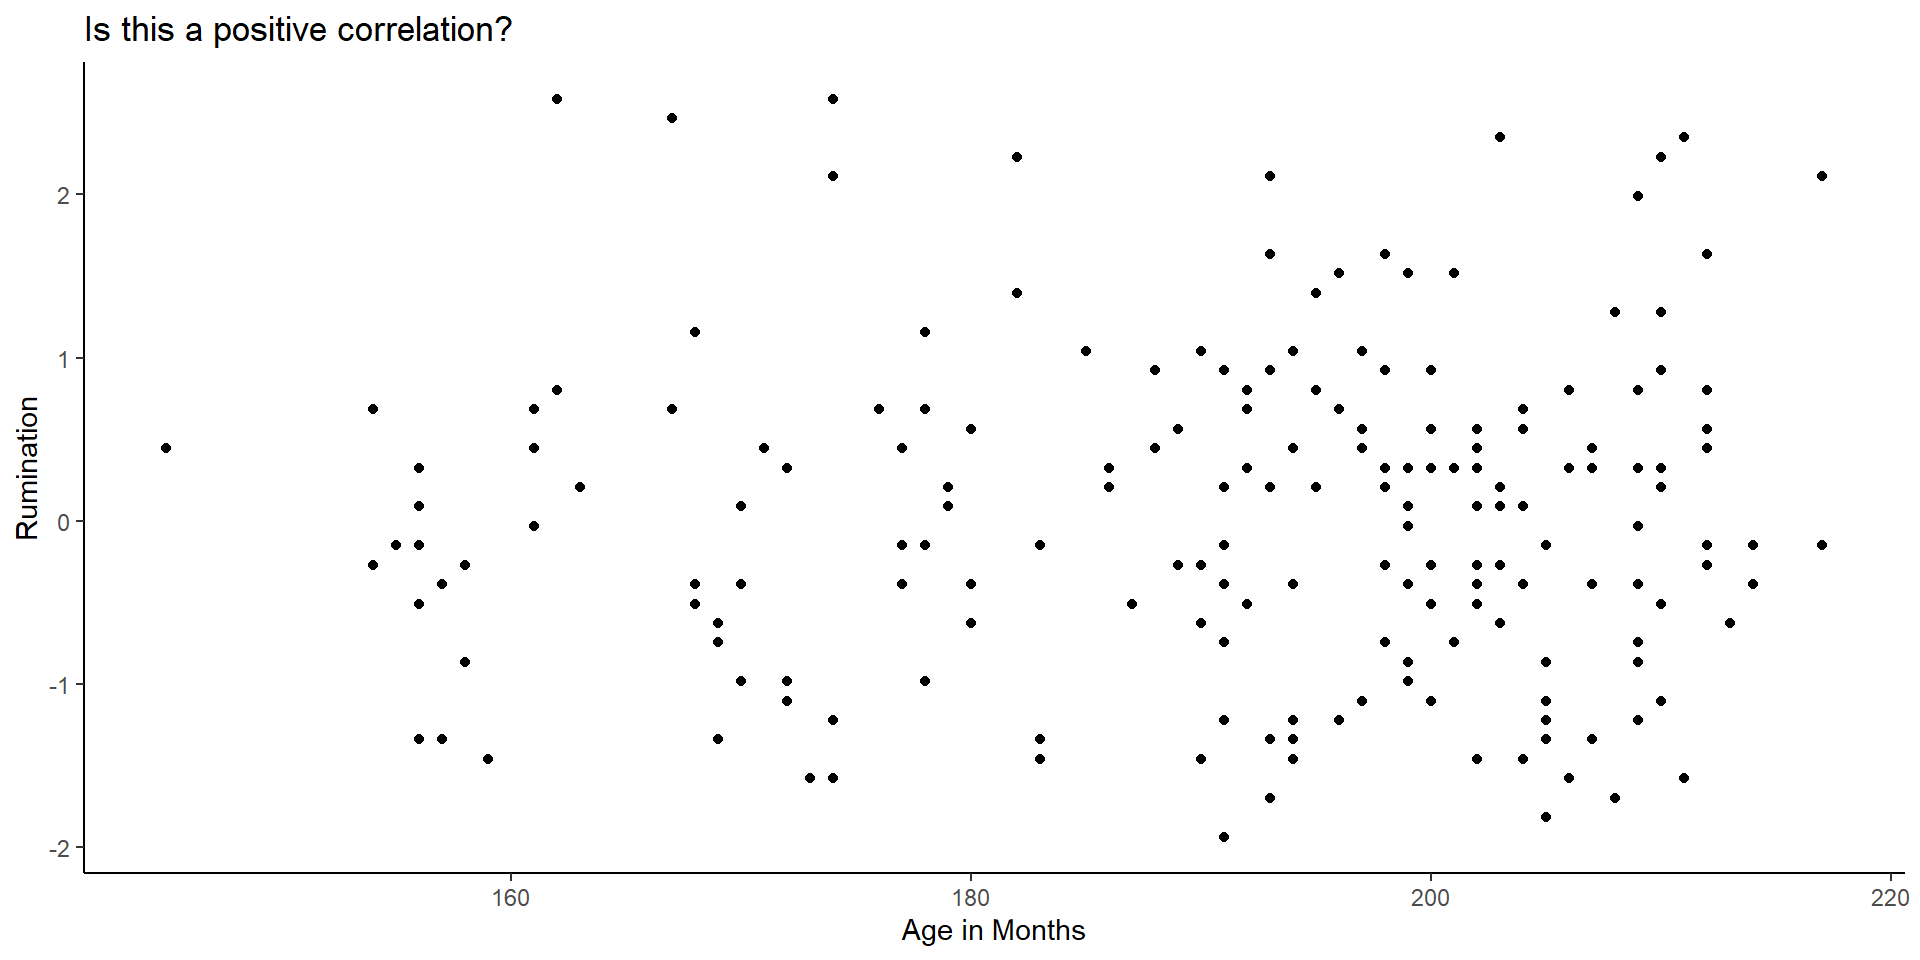
Scatter plots and direction of correlation (cont.)
- Let’s add the line of linear fit:
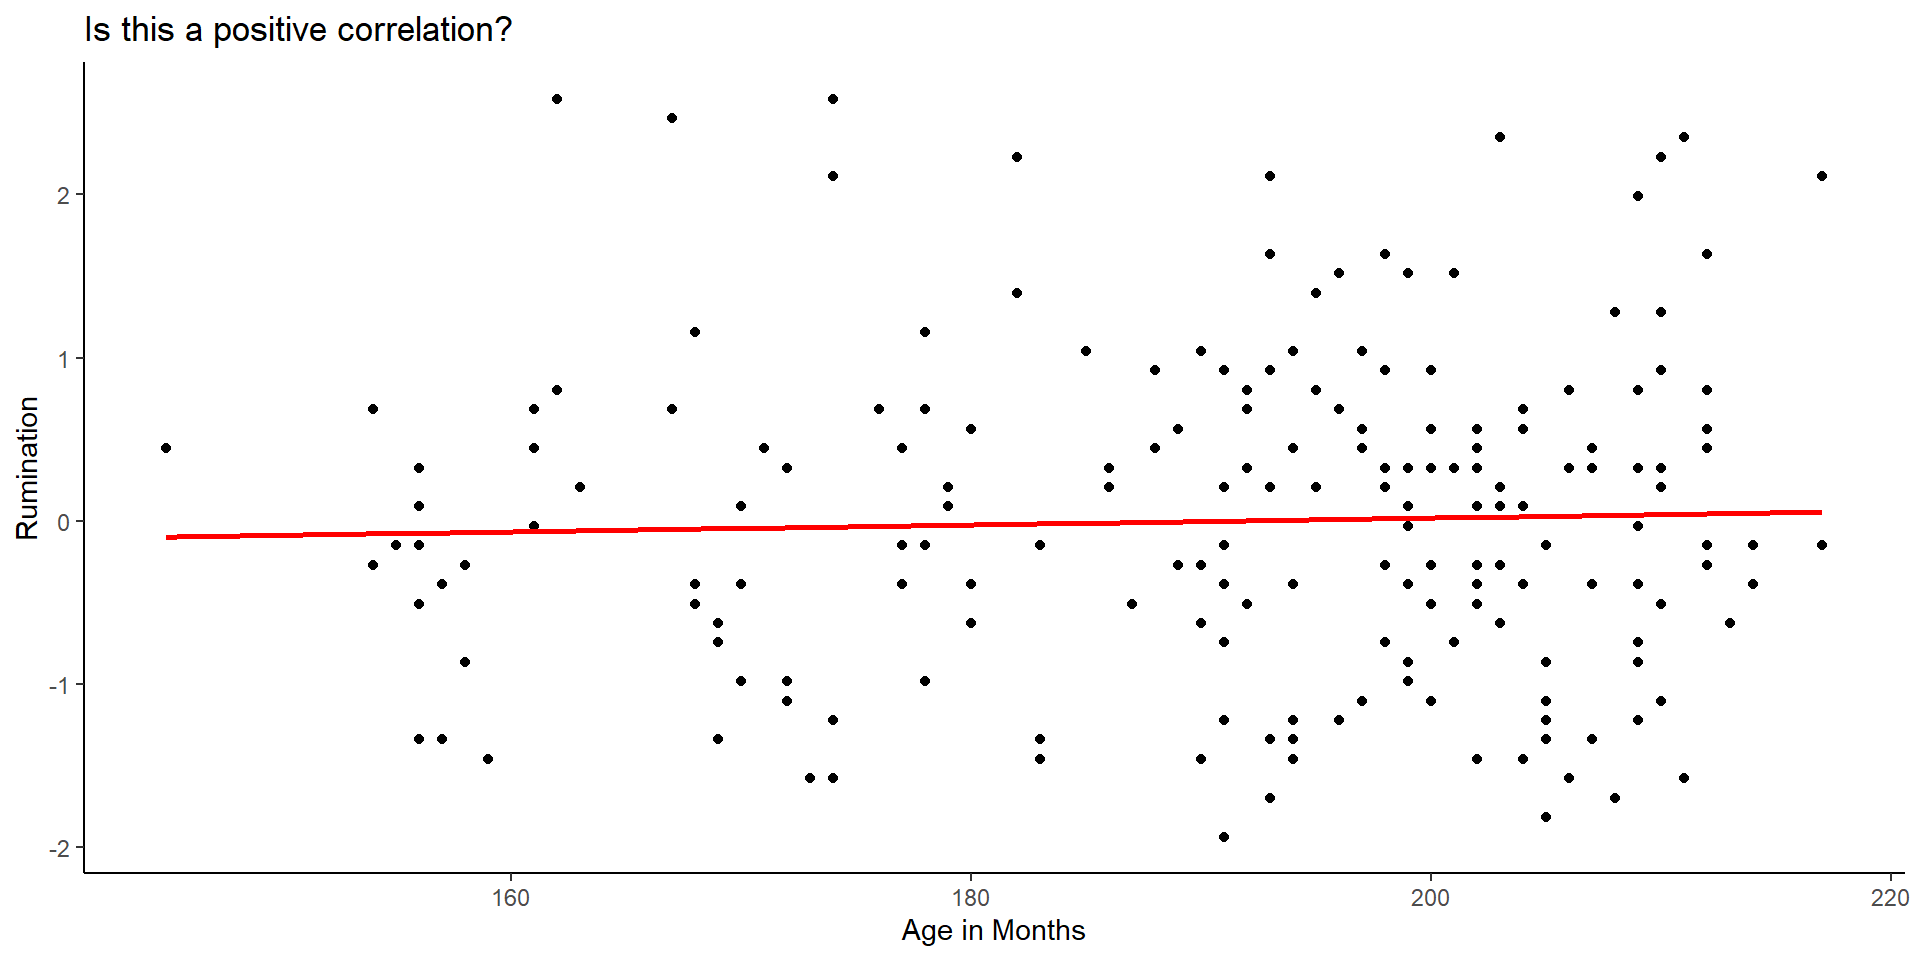
- In
Ryou can estimate Pearson correlations using the functioncor()as showed here:
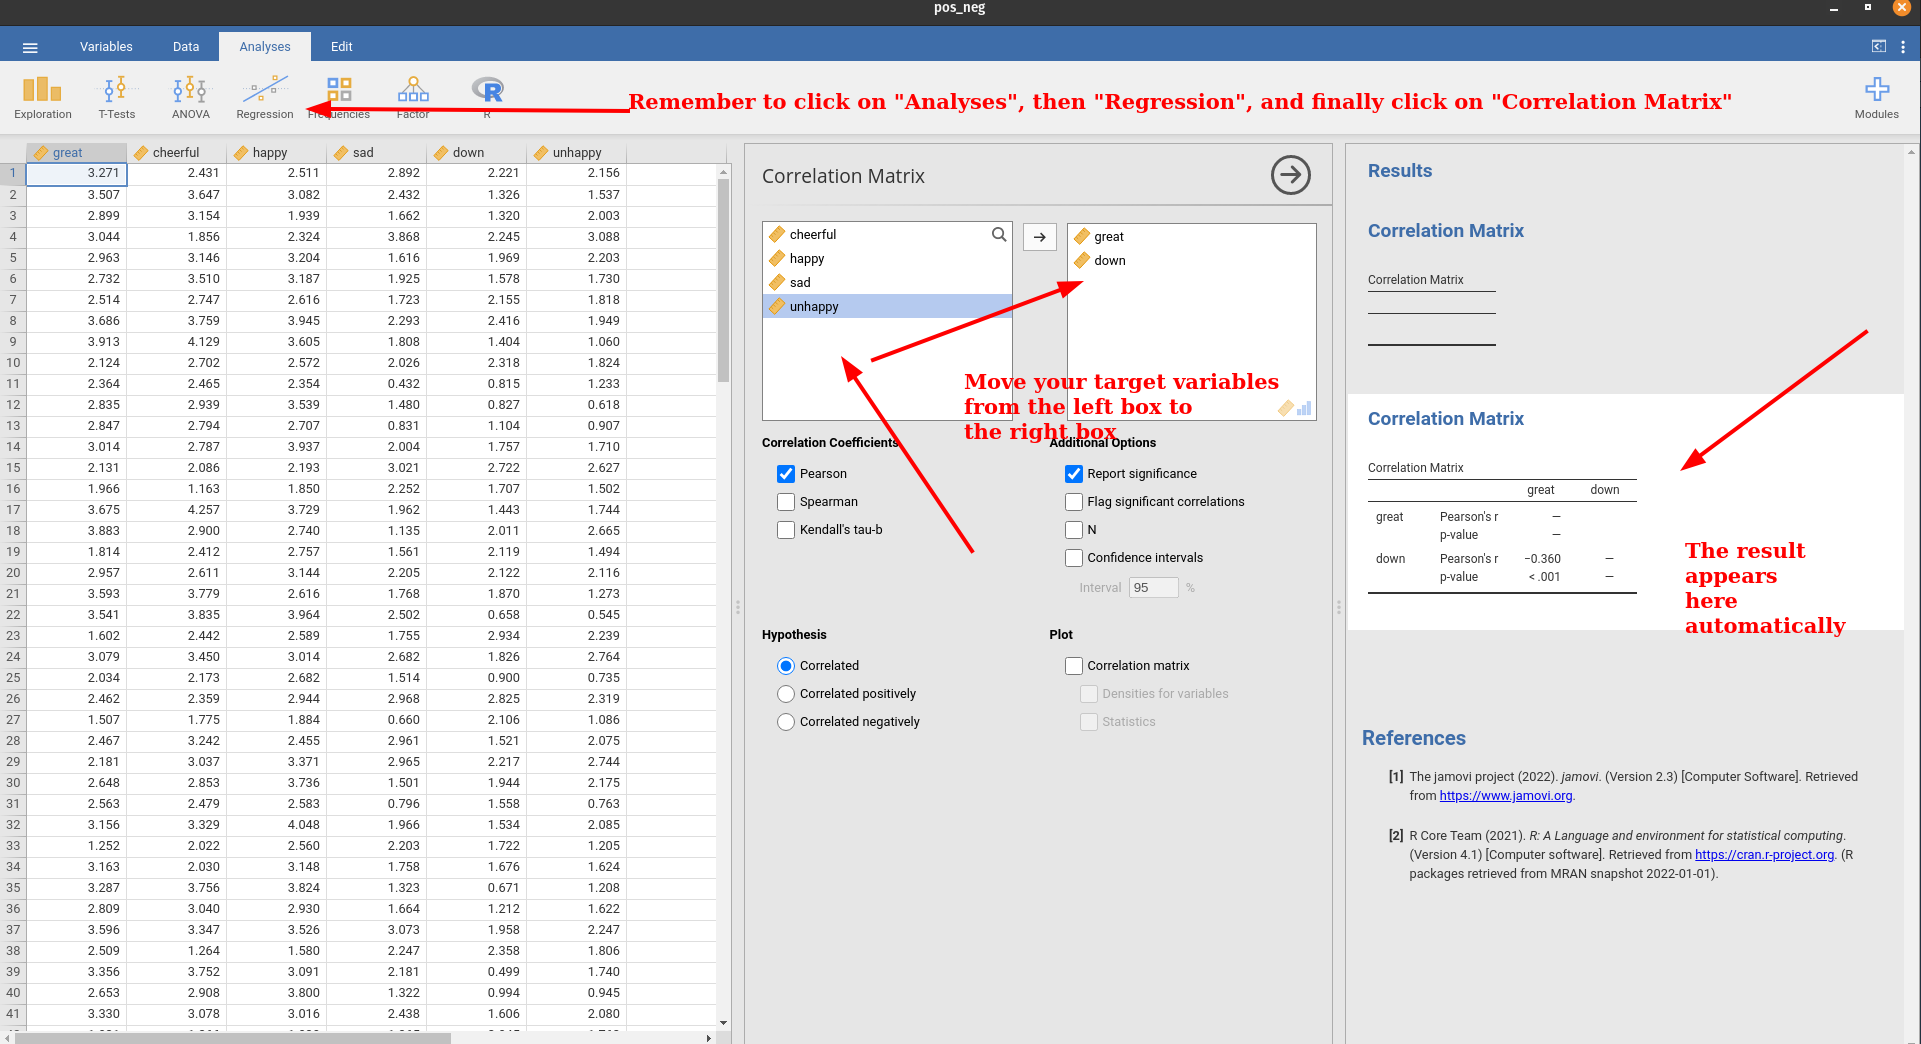
In this estimation, I’m calculating the correlation between the emotion DOWN and the emotion GREAT. The Pearson correlation was \(r= -0.36\). Is this a strong correlation?
- We could follow an ugly rule of thumb, but be careful, these are not rules cast in stone (Salkind & Shaw, 2020):

JAMOVI

JAMOVI