url <- "https://raw.githubusercontent.com/blackhill86/mm2/refs/heads/main/dataSets/anovaData.csv"
interData <- read.csv(url)Description
In this second assignment, you’ll have to solve several applied tasks. You’ll have the chance to solve applied data analysis tasks using R, or Jamovi.
What happens if you don’t understand how to answer an exercise ?
In this assigment I will provide videos on how to solve the exercises, or I’ll explain the solution in class. If after the explanation, you still have questions don’t hesitate to send me an email.
Part 1: Review important concepts
In this section, you will see TRUE/FALSE questions, or multiple choice questions. Select only one option. (10 points each correct answer).
Please copy the question along with your answer in a Word document.
- A \(t\)-test may be used when my dependent variable is continuous and the independent variable is a nominal variable with only two levels:
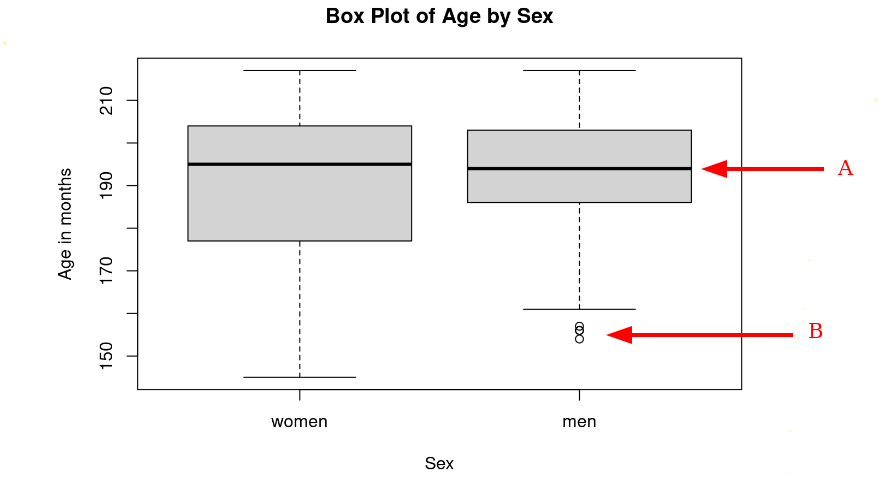
- The options to label A and B are:
(check the module "Data Visualizations on Canvas")
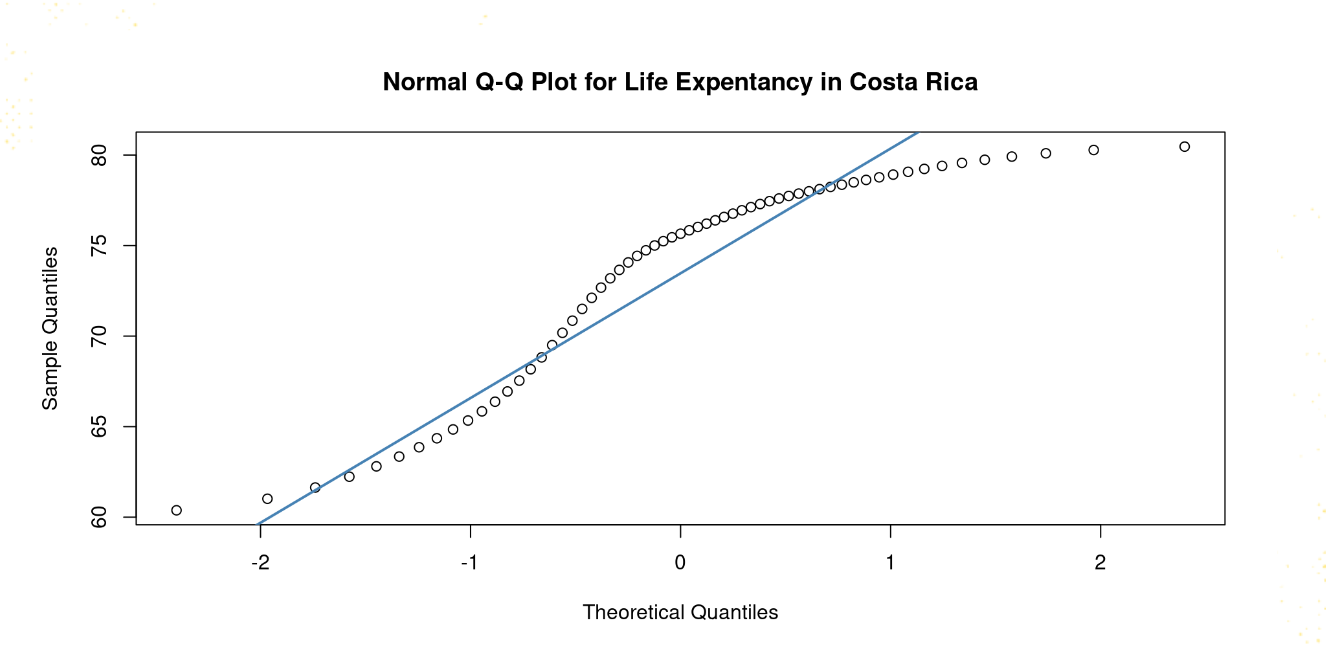
- The above figure is a QQ-plot, can you conclude that Life Expectancy in Costa Rica comes from a normally distributed process?
(check the module "Data Visualizations on Canvas")
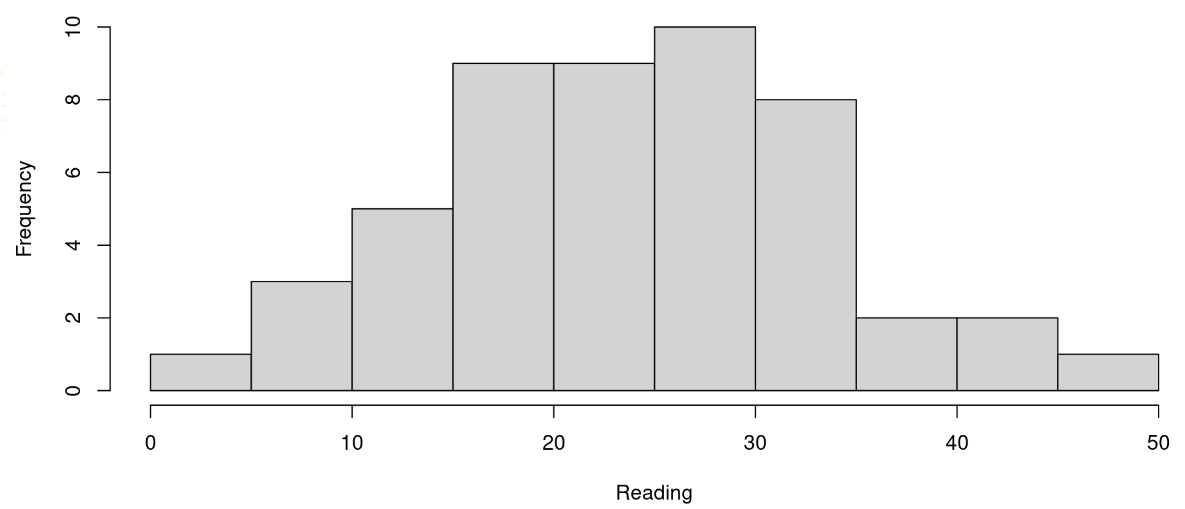
- The above figure represents a:
- In the Classical Regression Model, the estimated slope of the regression is often represented with the Greek letter \(\beta\) (beta). Taking this into consideration, if my estimated \(\beta\) is equals to a value greater than \(0\), I can conclude that there is a positive relationship between my outcome and my predictor:
- The Classical Regression Model does not have any distributional assumption on the predictors
- The Classical Regression Model assumes that the dependent variable or outcome must come from a normal distribution:
- The following model represents:
- One of the assumptions of ANOVA is constant variance in all groups:
- Pedro performed an experiment aiming to delay dementia symptoms in older adults. In this study, Pedro created three random conditions: A) A group attending yoga class, B) A group attending weight lifting, and finally, C) A group attending nutrition classes. Pedro measured the working memory capacity at the end of the study as a dependent variable. The problem for Pedro is that he doesn’t know which statistical model he should estimate.
What model should Pedro estimate on his data to test the mean differences between groups?
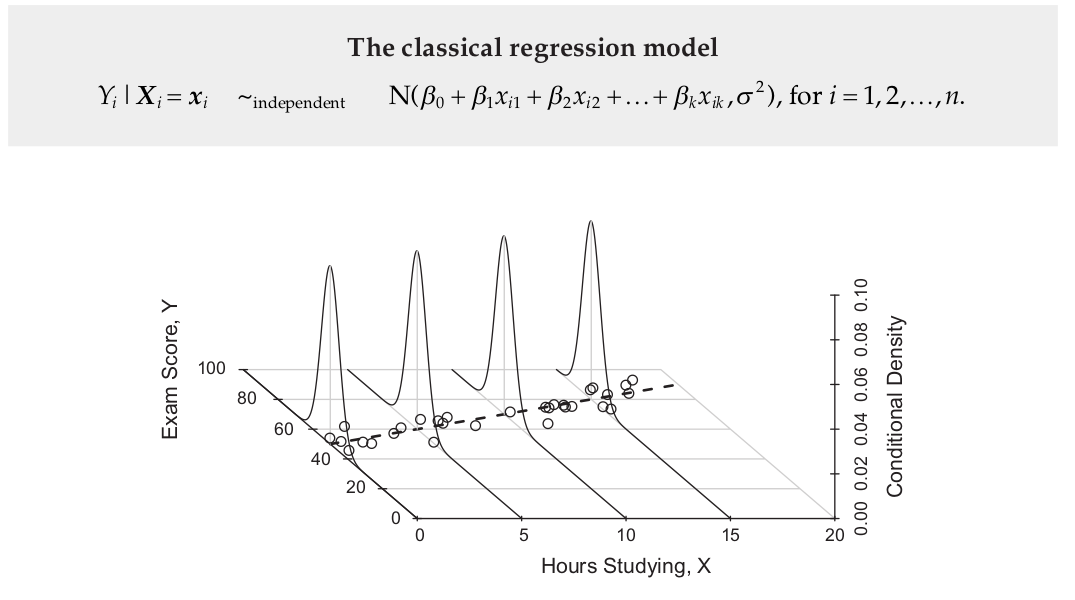
- According to the figure above, the Classical Regression Model assumes that the conditional probability distribution functions \(p(y|x)\) (y given x) are normal distributions:
- Again, following the figure above, we can say that the dashed line represents the linearity assumption:
- We can include nominal variables as predictors in a Classical Regression Model, but first we need to create dummy coded variables:
- The Classical Regression Model requires a continuous dependent variable:
- In the following figure \(\beta_{0}\) is called the “intercept”, and it represents the vertical height or distance from zero in \(Y\):
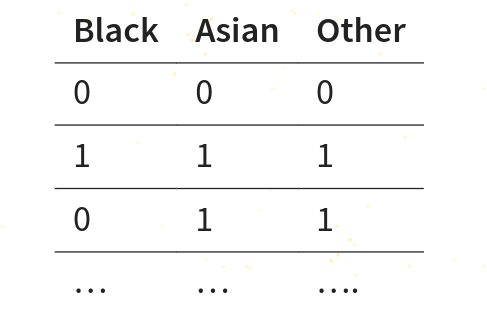
- The following table represents:
Second Part: Short answer questions
In this section, I expect short answers, where you explain in your own words relevant concepts:
Explain in your own words how to transform a nominal variable into several dummy coded variables. You may provide an example to make your explanation easier to follow. (10 points)
Describe the assumptions of the Classical Regression Model, you may check the lecture
Correlation and Regression Models Part 2. (10 points)
Third Part: Playing with JAMOVI and/or R
In this part you will use JAMOVI or R to answer several questions, the questions are a guide into different steps when performing an ANOVA.
JAMOVI users
You will use the data file named anovaData.csv, you may download the file from here. You will not use this link if you are planning on solving this part with R.
R users
You will need the following code to open the data set in R:
The data for this exercise is real data from an experimental intervention performed in Costa Rica in 2011. In this study, we aimed to answer the following question:
Will an intervention focused on improving autobiographical memory delay dementia symptoms?
Based on this question, we design an experiment where we assigned aging adults to 4 different conditions:
Condition A: Participants with mild cognitive impairment received the intervention.
Condition B: Participants with mild cognitive impairment did not receive the intervention.
Condition C: Healthy participants without cognitive impairment received the treatment.
Condition D: Healthy participants without cognitive impairment did not receive the treatment.
We measured the cognitive performance of the participants as dependent variable. The cognitive performance was measured before the intervention started, and it was measured again once the intervention finished. We utilized the Cambridge Cognition Examination (CAMCOG) to determine their cognitive performance. This is a long battery of tests, and at the end you can compute a total score that represents the cognitive status.
Higher scores in the CAMCOG are evidence of better cognitive performance, while lower scores represent a low cognitive performance.
After this explanation I hope the content of the data is startarting to make sense. In the data set anovaData.csv you will find the following columns:
ID: The study identification number for each participant.
CAMCOG_pre: the total score before the intervention started.
CAMCOG_post: the total score after the intervention finished.
Group: The intervention group where:
- A: Participants with mild cognitive impairment received the intervention.
- B: Participants with mild cognitive impairment did not receive the intervention.
- C: Healthy participants without cognitive impairment received the treatment.
- D: Healthy participants without cognitive impairment did not receive the treatment.
Video
You may watch this video to solve this part using JAMOVI.
Report the means and standard deviations of the
CAMCOG_postbyGroup, paste the table fromJAMOVIorR. In addition, create a plot inJAMOVIorRshowing the mean values ofCAMCOG_postbyGroup. (20 points)Interpret the estimated mean values. Do you see a large difference in the mean score when comparing healthy aging adults versus aging adults with dementia? Do you observe in the bar plot a remarkable difference between groups
AandB? ( 20 points)ANOVA has two important assumptions, constant variance and normality. Perform the Shapiro-Wilk’s test, to asses the normality assumption, and the Levene’s test to evaluate the assumption of constant variance. Paste the tables from
JAMOVIorRand interpret the results. (20 points).Perform an omnibus ANOVA analysis to determine if there is any mean difference not explained by chance alone. Paste the table from
JAMOVIorRin your answer (20 points).According to the \(p\)-value. What is your conclusion? (18 point)
At this point we have performed a omnibus test, this test does not tell which group differs beyond chance from the other groups. Perform a post-hoc analysis to determine where are the differences between groups and which differences are not explained by chance alone. Paste the table generated in
JAMOVI. After that, interpret the results. (20 points)